English
English
Running, refers to running the project, you can modify the code, see the modification results immediately, and log the log (console.log) at the same time.
Debugging, also known as debug, can further break points, single-step traces, and view stack information on the basis of running.
uni-app can be run with the npm command of the cli project, but more importantly, DCloud provides HBuilder, a special development tool for uni-app, which can better develop uni-app.
If you use a cli project to run uni-app in a non-HBuilder environment, just execute the normal npm run dev:%platform% command to run it with an external tool. [See details](../quickstart-cli.md#%E8%BF%90%E8%A1%8C, release uni-app)
This article focuses on the running and debugging methods in HBuilder.
Briefly, HBuilder provides uni-app with a built-in web browser, web-side debugging environment, App's real machine running environment, App debugging environment, uniCloud running environment, and uniCloud debugging environment.
- running container aspects
| web | app | Mini Program | uniCloud | |
|---|---|---|---|---|
| uni-app+other IDEs | runs in common browsers | not supported | third-party applet development tools | not supported |
| uni-app+HBuilder | HBuilder has an additional built-in browser | Support | Three-party applet development tools | Support |
- debug aspect
| web | app | Mini Program | uniCloud | |
|---|---|---|---|---|
| uni-app+other IDE | Video IDE function | Not supported | Relying on third-party applet development tools | Not supported |
| uni-app+HBuilder | Support | Support | Rely on third-party applet development tools | Support |
# run debug entry
# Run entry
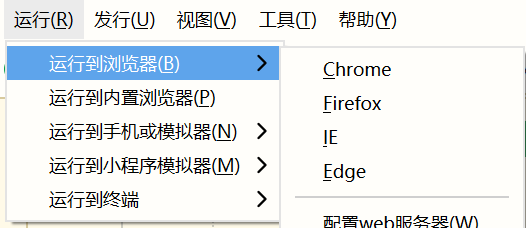
In HBuilder, there are three run entries: top menu, toolbar run button, and shortcut keys.
- Top run menu
- The run button on the toolbar
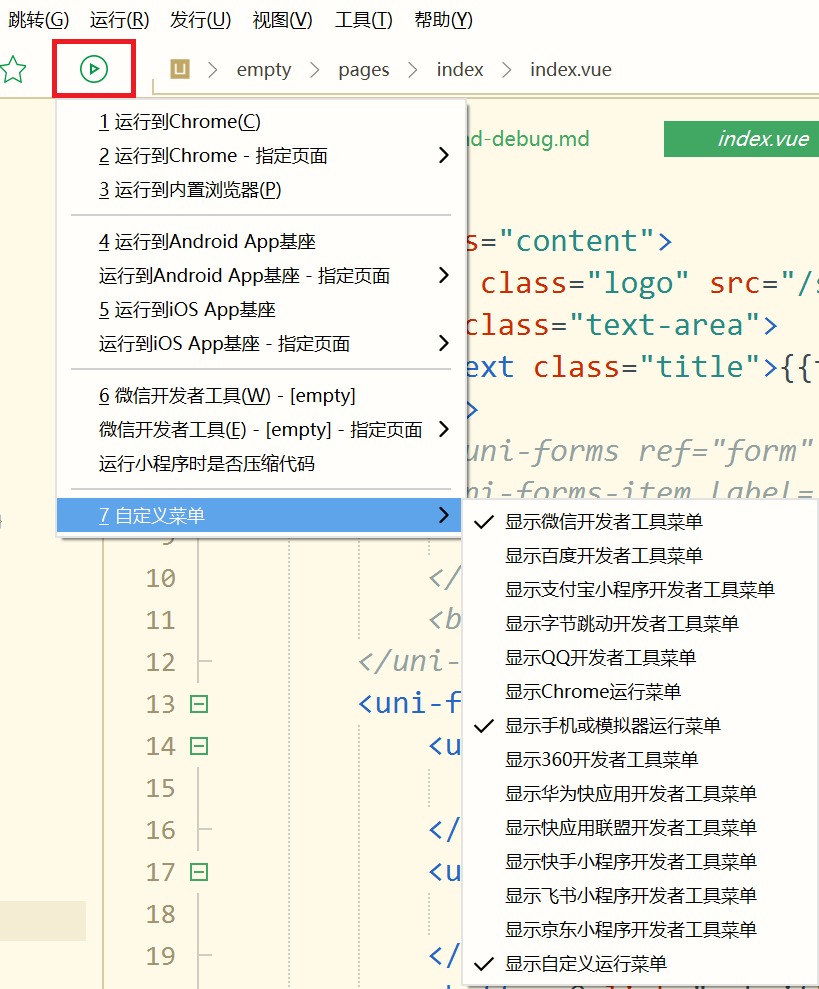
The toolbar's run button will expand a menu when clicked. This menu is configurable to collapse infrequently used run items via the `Custom Menu`.
Shortcuts
The shortcut key to run is [Ctrl+r]
The pop-up menu also supports keyboard shortcut selection: press Enter to select the first item of the menu; press the number to quickly select the menu item corresponding to the number at the beginning of the menu item.
If you can't see the relevant menu, then the file currently opened by HBuilder is probably not a file under the uni-app project.
# Debug entry
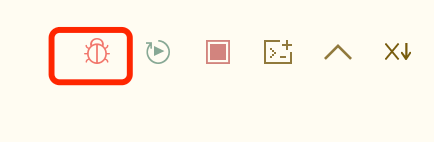
uni-app is generally run first and then debugged. The debug entry is on the console after running.
After running the console, there will be a red bug icon or a debugging checkbox in the upper right corner.
# Online Platform Troubleshooting
After the application is launched, there may be errors reported in various user environments, which require statistics and analysis by developers. However, the three-party statistical system (such as Youmeng, Aladdin, and Baidu) collects the error reports on the running side, and it prompts the number of error lines in the code compiled by the uni-app compiler, which is equivalent to garbled characters, and cannot tell the developer that it is uni-app Which line of code in vue or js reports an error.
In order to solve this problem, DCloud provides the sourceMap function of uni statistics. In the background of uni statistics, you can clearly see the error reporting environment and accurate error code. It is the specific information of vue or js before uni-app compilation. See details