English
English
# uts Android debug
uts在Android上的调试,包括3部分:
- uni-app和uni-app x的uts插件的uts代码。需HBuilderX 4.0+
- uni-app和uni-app x的uts插件的混编kt代码。需HBuilderX 4.61+
- uni-app x的uvue页面。需HBuilderX 4.61+
uts、uvue、kt,这三种文件,本质上都是在调试运行时的kt文件。
HBuilderX中可以对这3种文件打断点,联编、跨语言、跨文件跳转断点。
# Enable debugging
As shown in the following Gif animation, run the uni-app uts project to Android. After running successfully, click the red bug icon in the HBuilder console, and select [uts debugging] from the drop-down menu to enable the uts debugging function.
注意:如果需要触发应用初始化中的断点,比如App.uvue的onLaunch中,需要点击
红色虫子图标右边的重启应用按钮,重启之后应用初始化中的断点才会生效
注意:目前部分变量的显示可能还是以kotlin的方式显示,因为uts编译结果是kotlin
如果需要调试kt代码的话,需要安装插件kotlin-language。(在打开kt文件时hx会自动提示需要安装该插件)
注意:断点时App可能会出现Application Not Responding(应用无响应)的弹框(部分机型的表现是app会重启),这是因为调试默认是以Attach的方式连接,Android系统不允许UI线程被阻塞太长时间,点击下一步或者断点结束时该弹框会自动消失。(开启断点之后点击点击
红色虫子图标右边的重启应用按钮会以调试模式启动, 此时断点时不会出现应用无响应的弹框)
# 注意事项
1、默认打开调试时app并不是以调试模式启动的,这可能会造成一些问题,比如Application Not Responding,也就是应用程序无响应。表现为: 出现弹框显示程序无响应。部分手机可能会出现卡顿或者各种奇怪问题,这是因为有的手机厂商并不希望去调试没有开启调试模式的app。
解决办法: 在debug开启之后需要点击
红色虫子图标右边的重启应用按钮,这时候app会以调试模式启动。
Hx默认是以附加的方式来调试应用,这样的好处是用户如果默认不是以调试模式启动的app,也可以在测试途中来调试应用,而不需要重启应用再走一遍测试流程。
开启调试模式的好处是不会出现anr,同时手机厂商一般不会对开启调试模式的app做一些限制。
2、有时候监视区域或者变量区域可能无法显示变量(比如this.xxx.xxx 这时候可能无法查看xxx的内容),目前显示的内容很多都是kotlin的展示方式,但用户肯定是希望以uts的方式展示和查看。(优化中)
3、变量区域没有显示全局变量和上一级作用域的变量信息 (优化中)
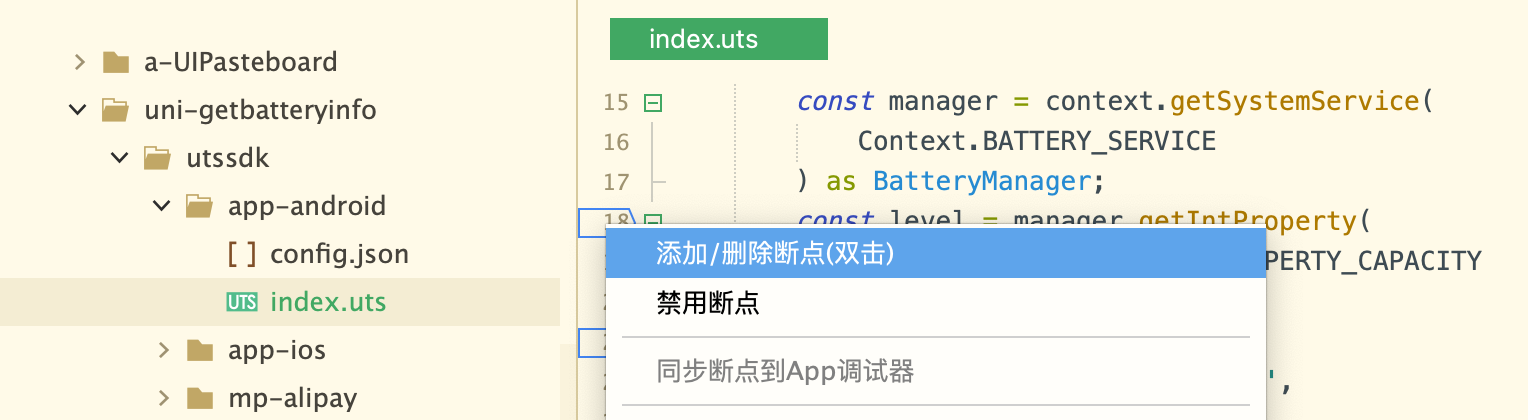
# Add/remove breakpoint
Open the uts file to be debugged, and right-click or double-click on the code line number to add a breakpoint.
# Debug View
After debugging is enabled, you can see the debugging view in the left view of HBuilderX, as follows:
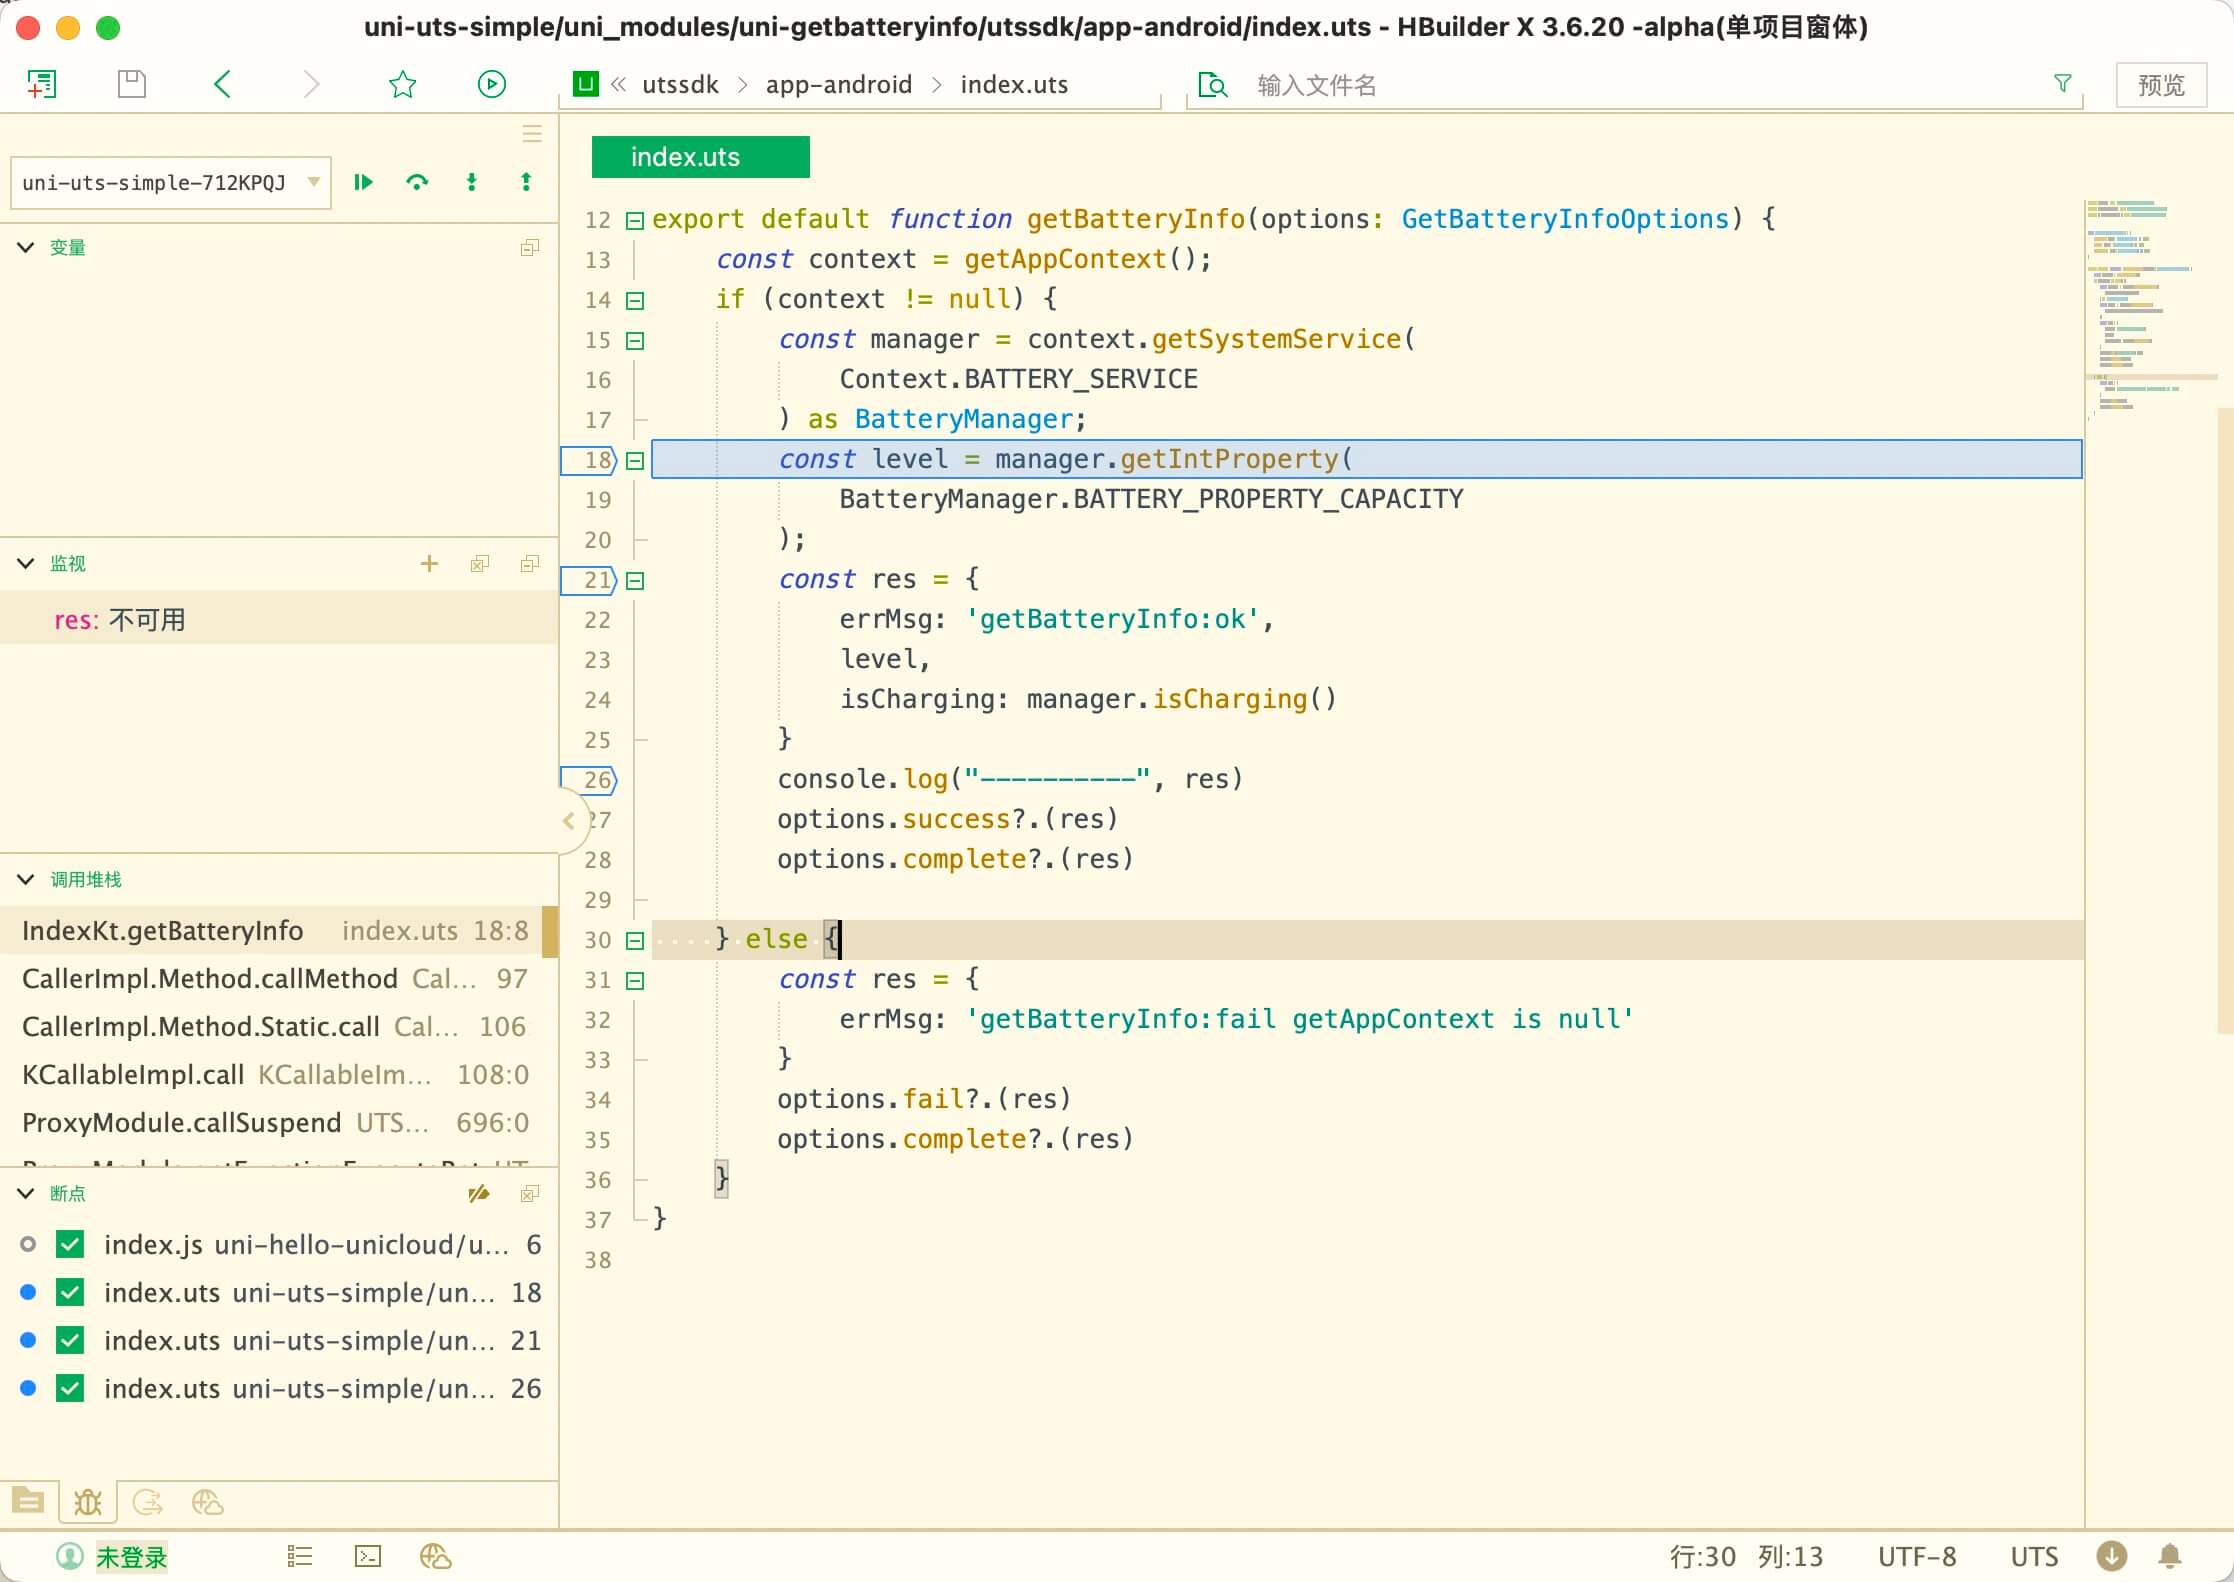
下图中包含了uvue、uts、kotlin的调试步骤

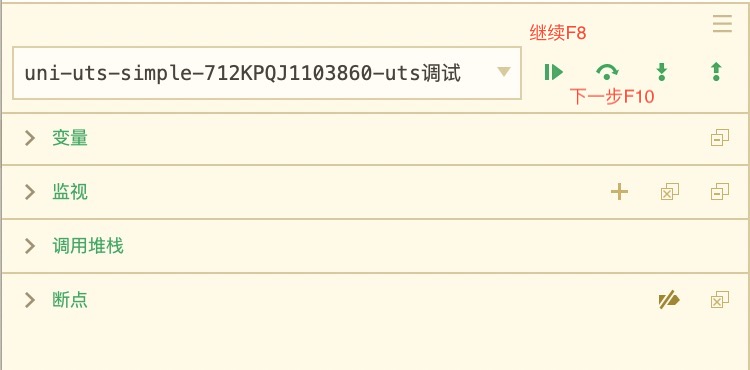
The debug view is divided into 5 parts:
- 调试工具栏
- Variables window (
Copy value,Copy expression,Add to watch) - Watch window (contains
add/edit/deleteexpressions, andcopy value) - call stack window
- Breakpoints window (contains
remove/enable/disablebreakpoints)
# Debug Actions
- continue with
F8 - next step
F10 - Enter
F11 - Back to
Shift+F11
# Data checking and viewing variables
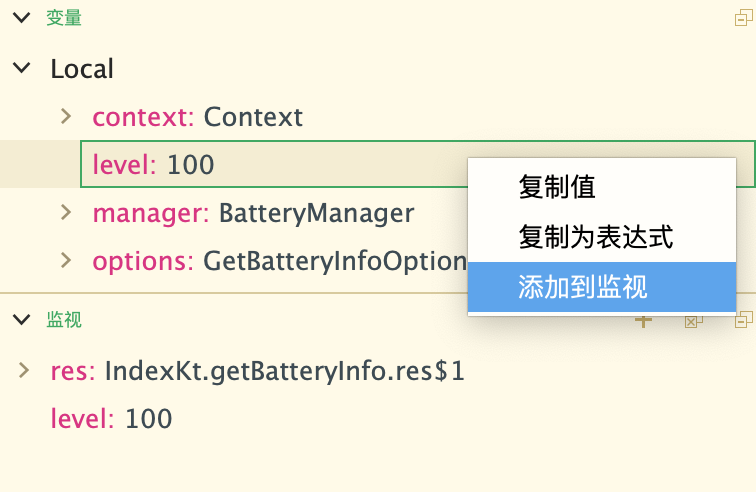
# Add to watch
In the 【Variable Window】, select the variable and right-click the menu to add the variable to the monitoring window.
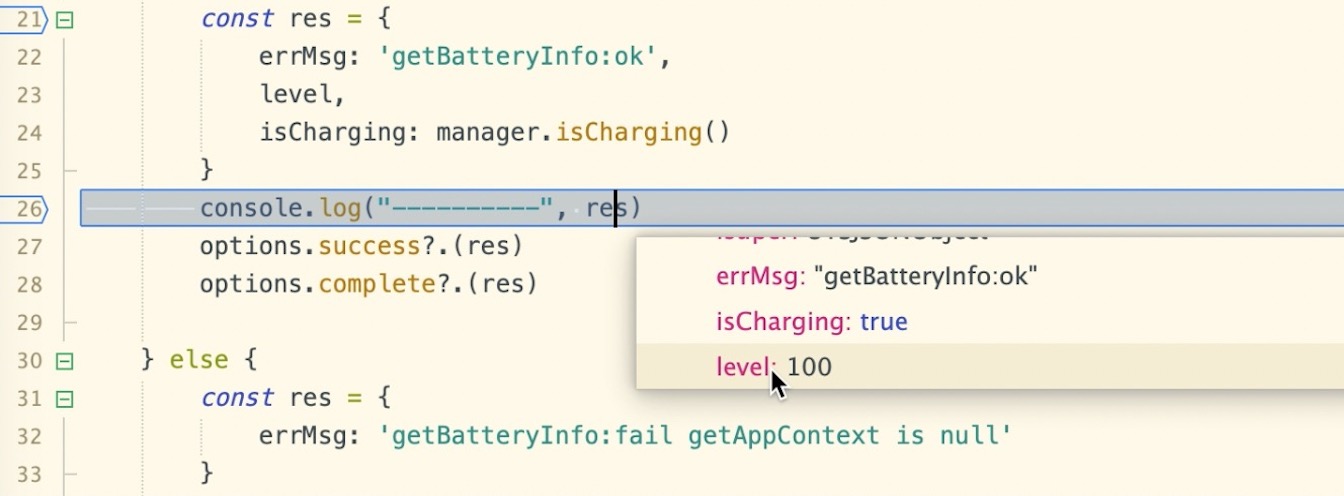
# Hover display
During breakpoint debugging, hover the mouse over the variable to be viewed to open the hover window.