English
English
# uni-app web version debugging
HBuilderX 3.5.0 version, uni-app runs on the web platform, and can be debugged through the debugging panel that comes with HBuilder.
# Introduction
- After running uni-app to the web, it supports debugging js code in the debugging panel that comes with HBuilder.
- 调试需要本机安装chrome浏览器,因为使用了chrome debug 协议
- 调试支持的文件类型:
vue文件、uvue文件、nvue文件、uts文件、ts文件、js文件,断点只能打在js等script代码中,请勿在vue文件template、style节点添加断点。
Precautions:
- uni-app, in some life cycle methods, add breakpoints, after debug debugging, breakpoints cannot be entered.
- For the uni-app Vue3 project, after debugging, a file in a virtual directory may be opened in HBuilderX, such as
/localhost:3000/src/pages/index/index.vue. Debug debug view, click Continue.
# Enable debugging
Project Manager, select any uni-app project, run to Chrome. In the upper right corner of the console, click the debug icon (red bug) to enable debugging. As shown below:
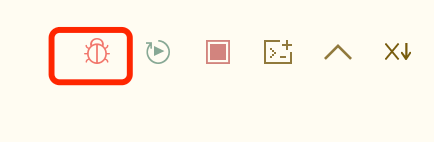
uni-app web debugging, depends on the debug plug-in, the pop-up window prompts to install the dependent plug-in, be sure to click install, otherwise the debugging cannot be performed.
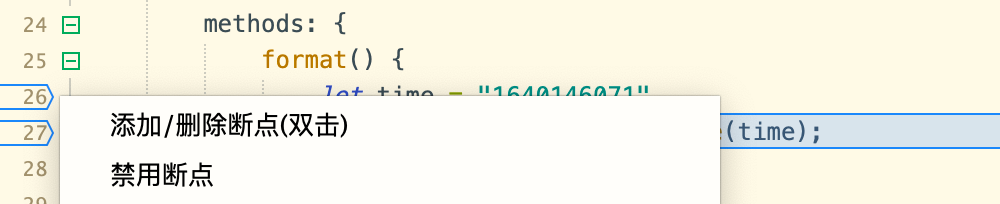
# Add/remove breakpoints
Open the file to be debugged, right-click or double-click on the js or ts code line number to add a breakpoint.
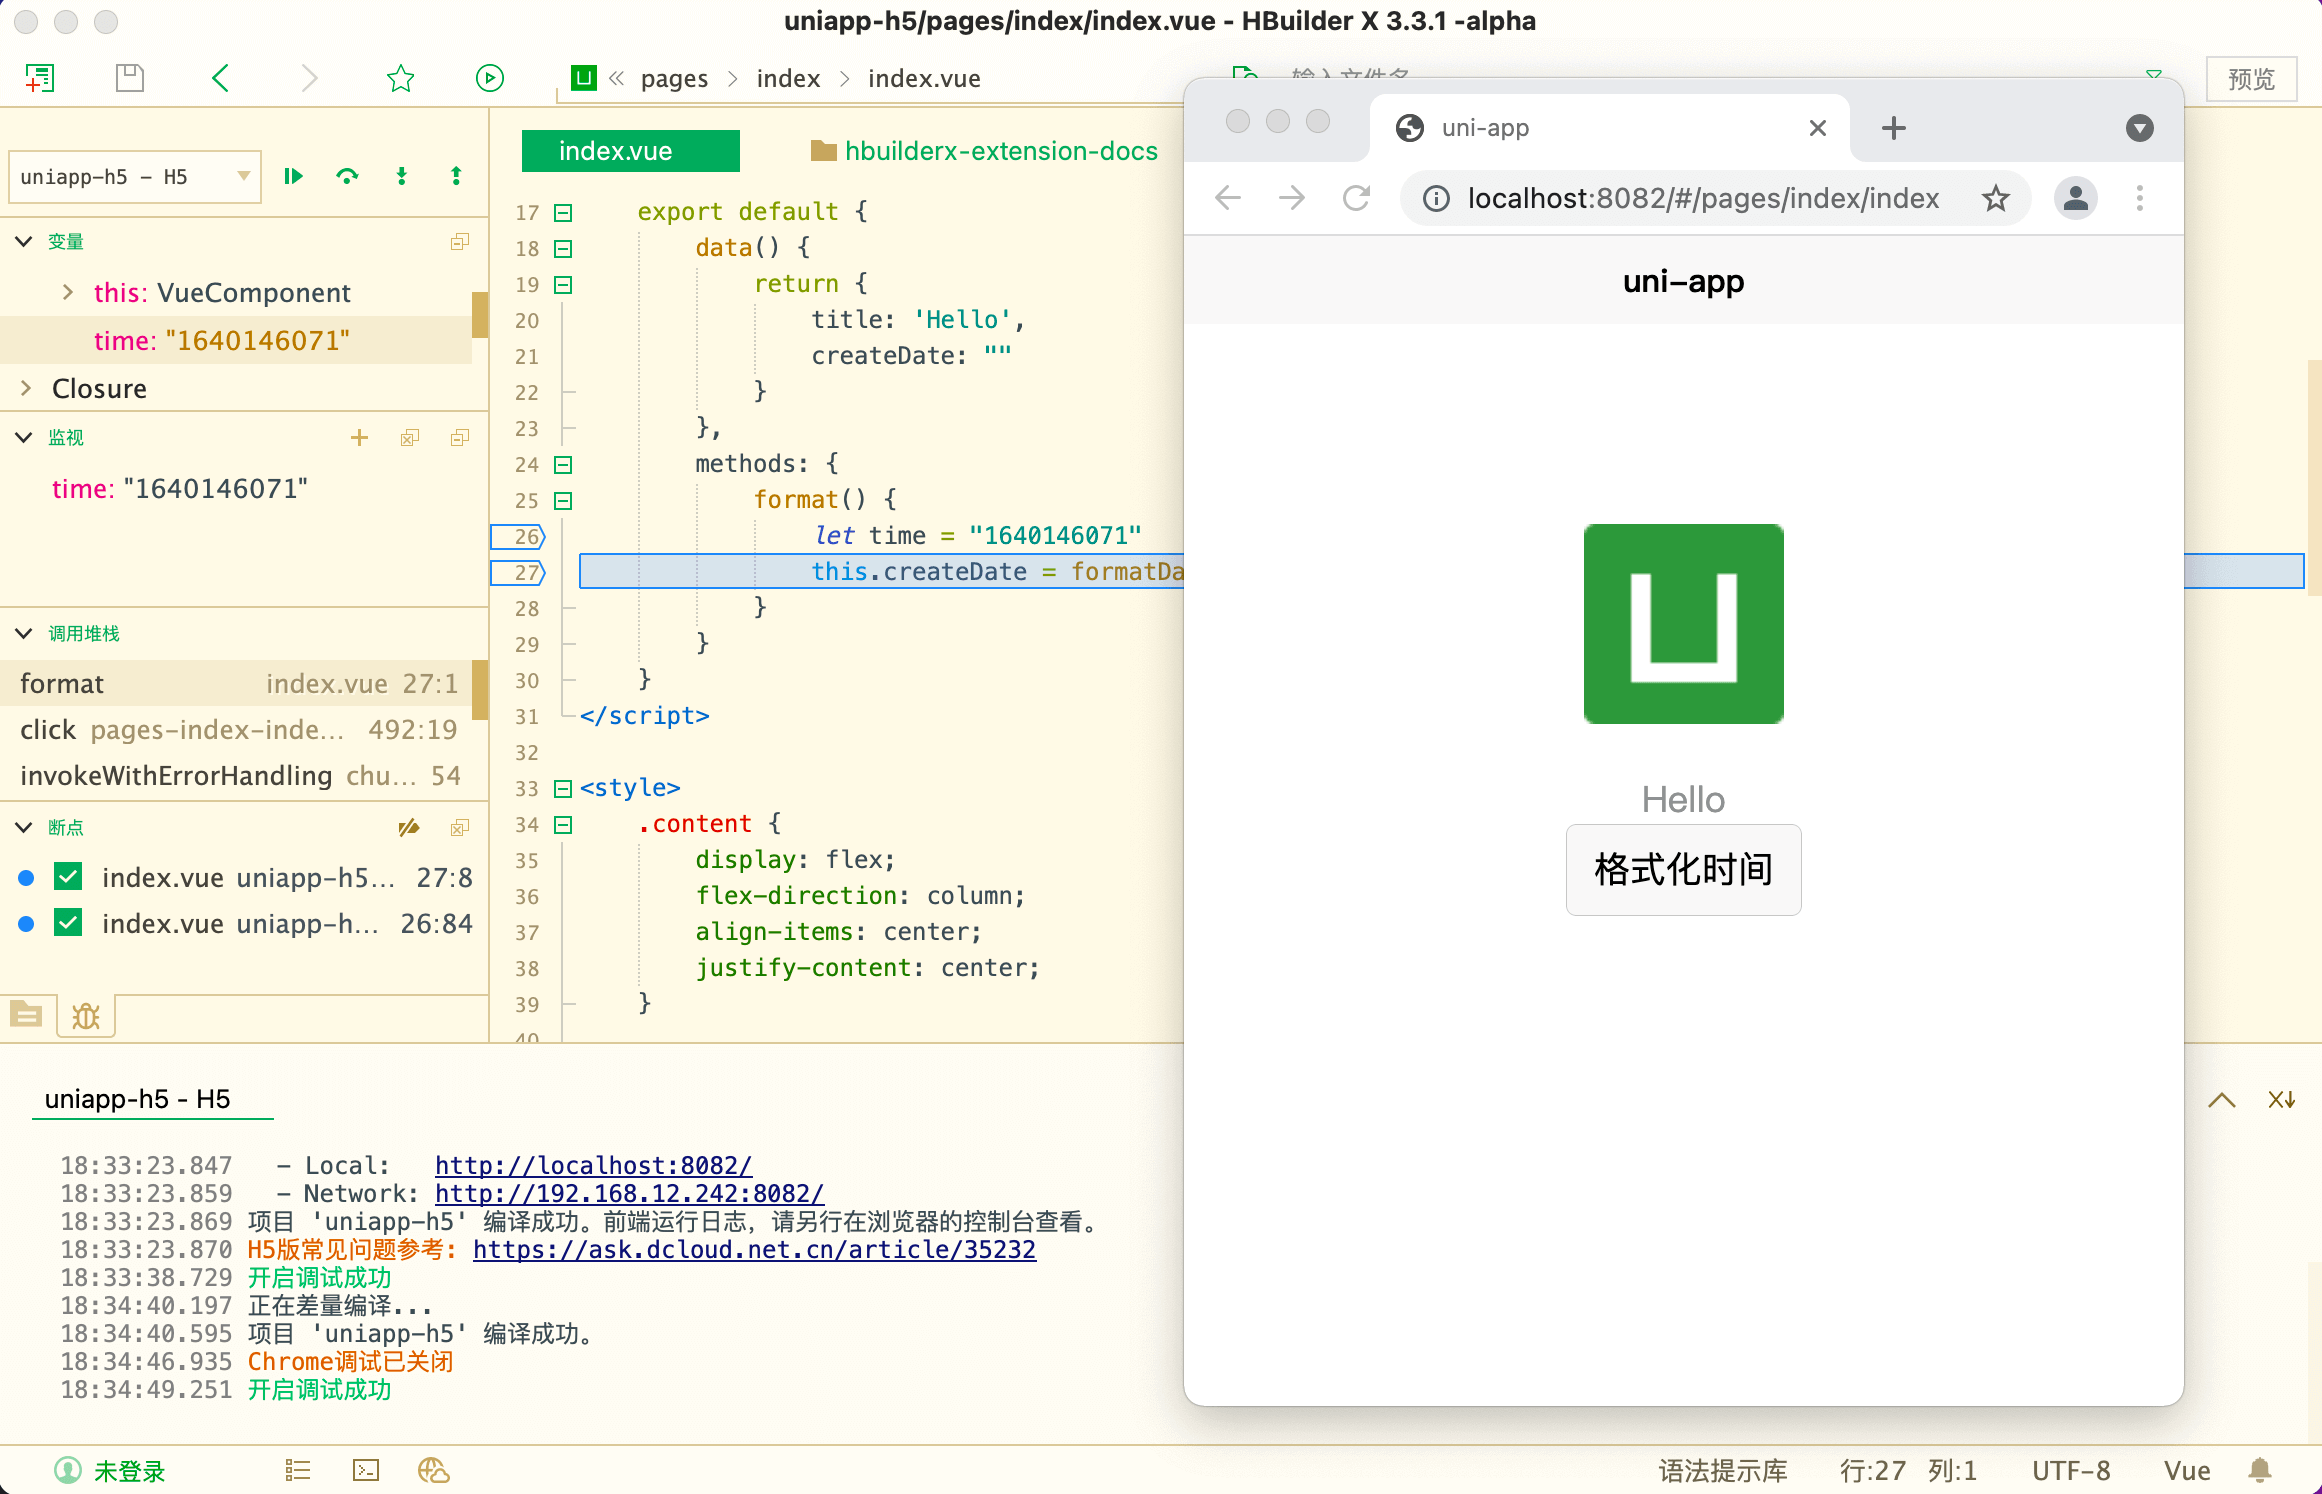
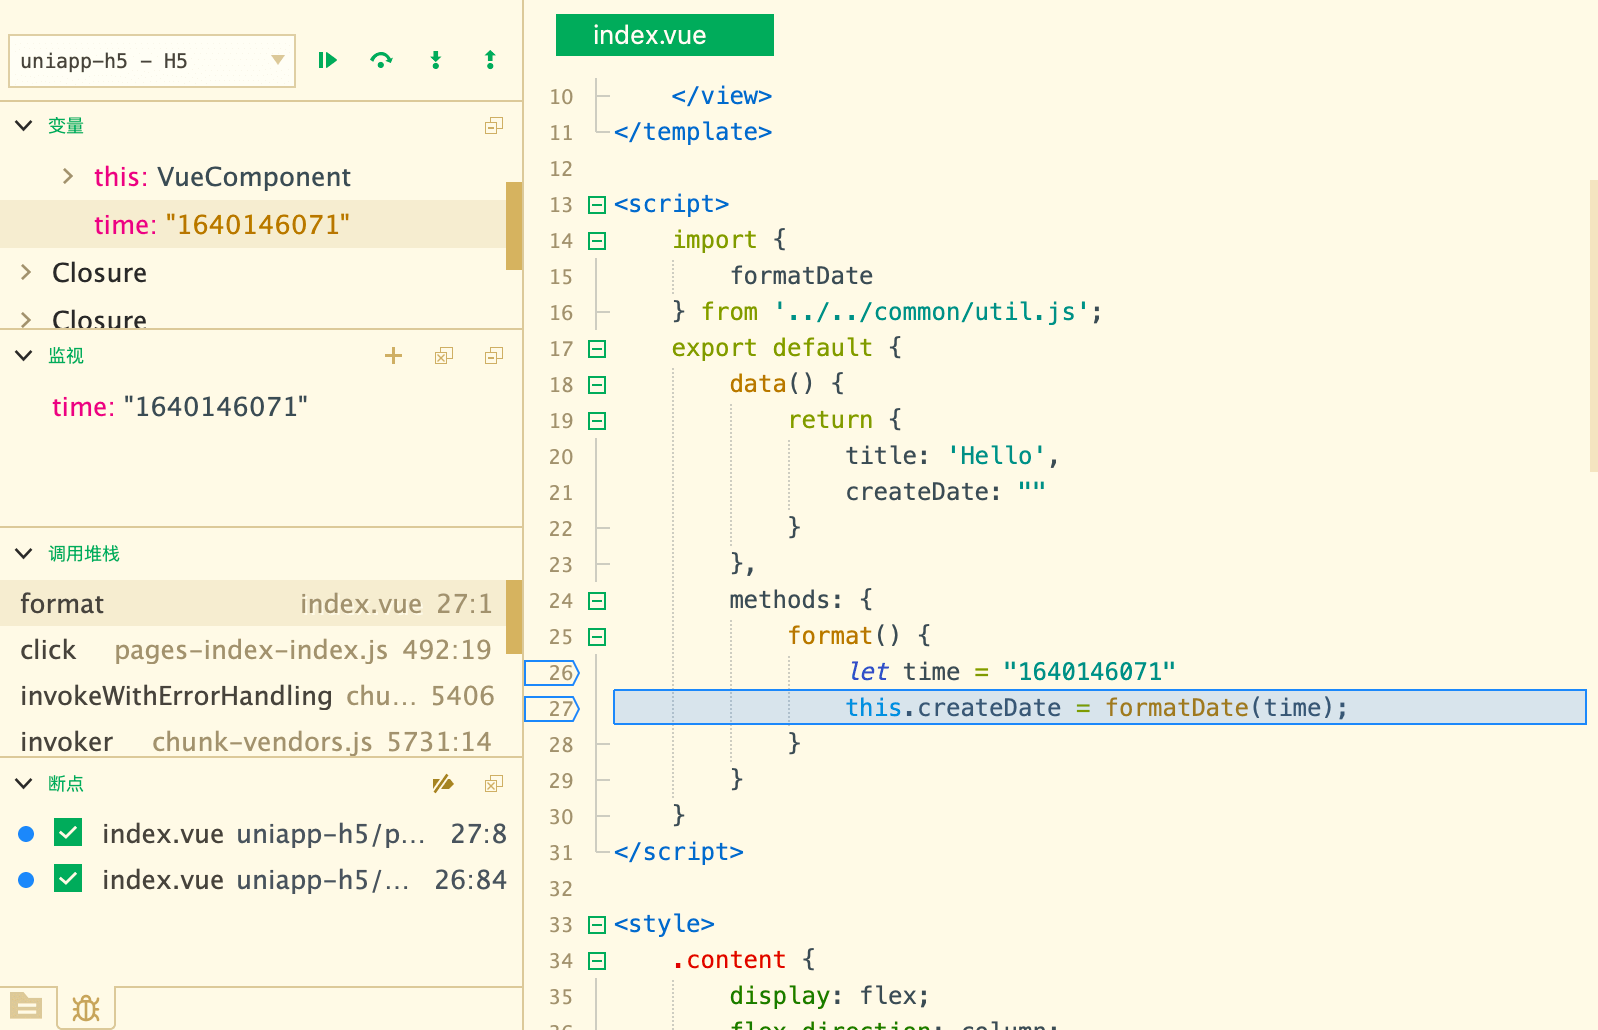
# Debug View
After enabling debugging, you can see the debugging view in the left view of HBuilderX, as follows:
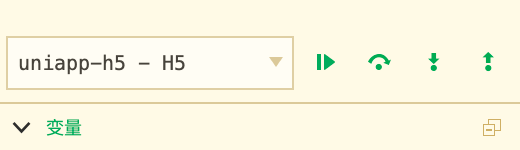
调试视图分为5部分:
- 调试工具栏
- Variable window (
Copy Value,Copy Expression,Add to Watch) - Watch window (including
add/edit/deleteexpressions, andcopy value) - Call stack window
- Breakpoints window (contains
delete/enable/disablebreakpoints)
# Debug actions
- 继续
F8 - Next
F10 - Enter
F11 - go back to
Shift+F11
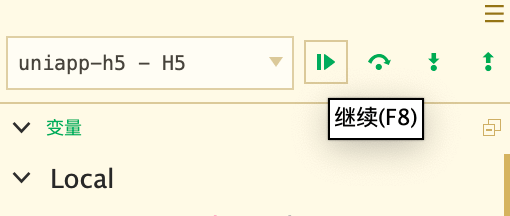
# Continue
Continue (F8): When clicked, run until the next breakpoint.
# Data check and view variable
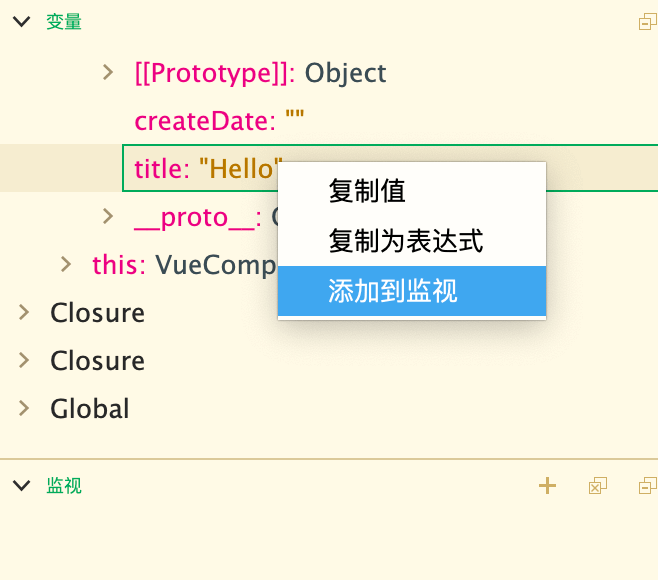
# Add to watch
In the [Variable window], select the variable, right-click the menu, you can add the variable to the monitoring window.
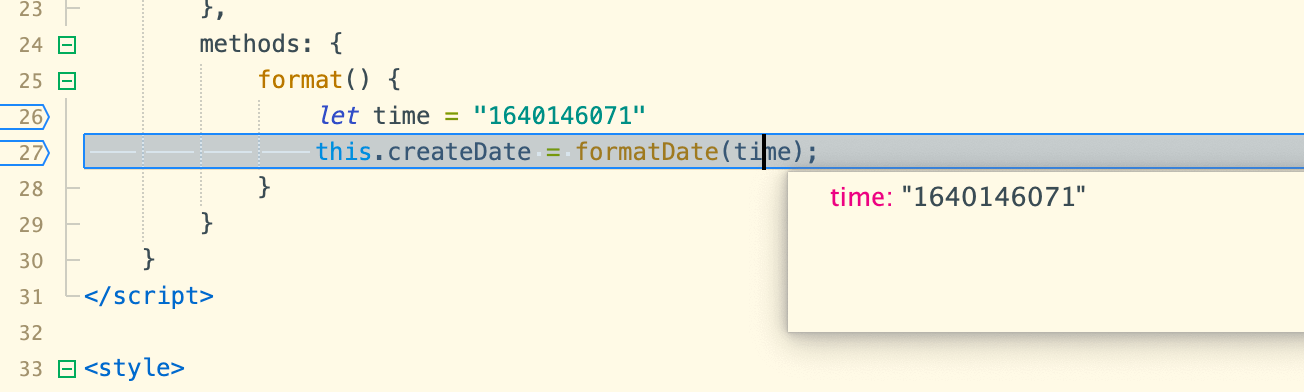
# Hover to show
During breakpoint debugging, hover the mouse over the variable you want to view to open the hover window.