
English
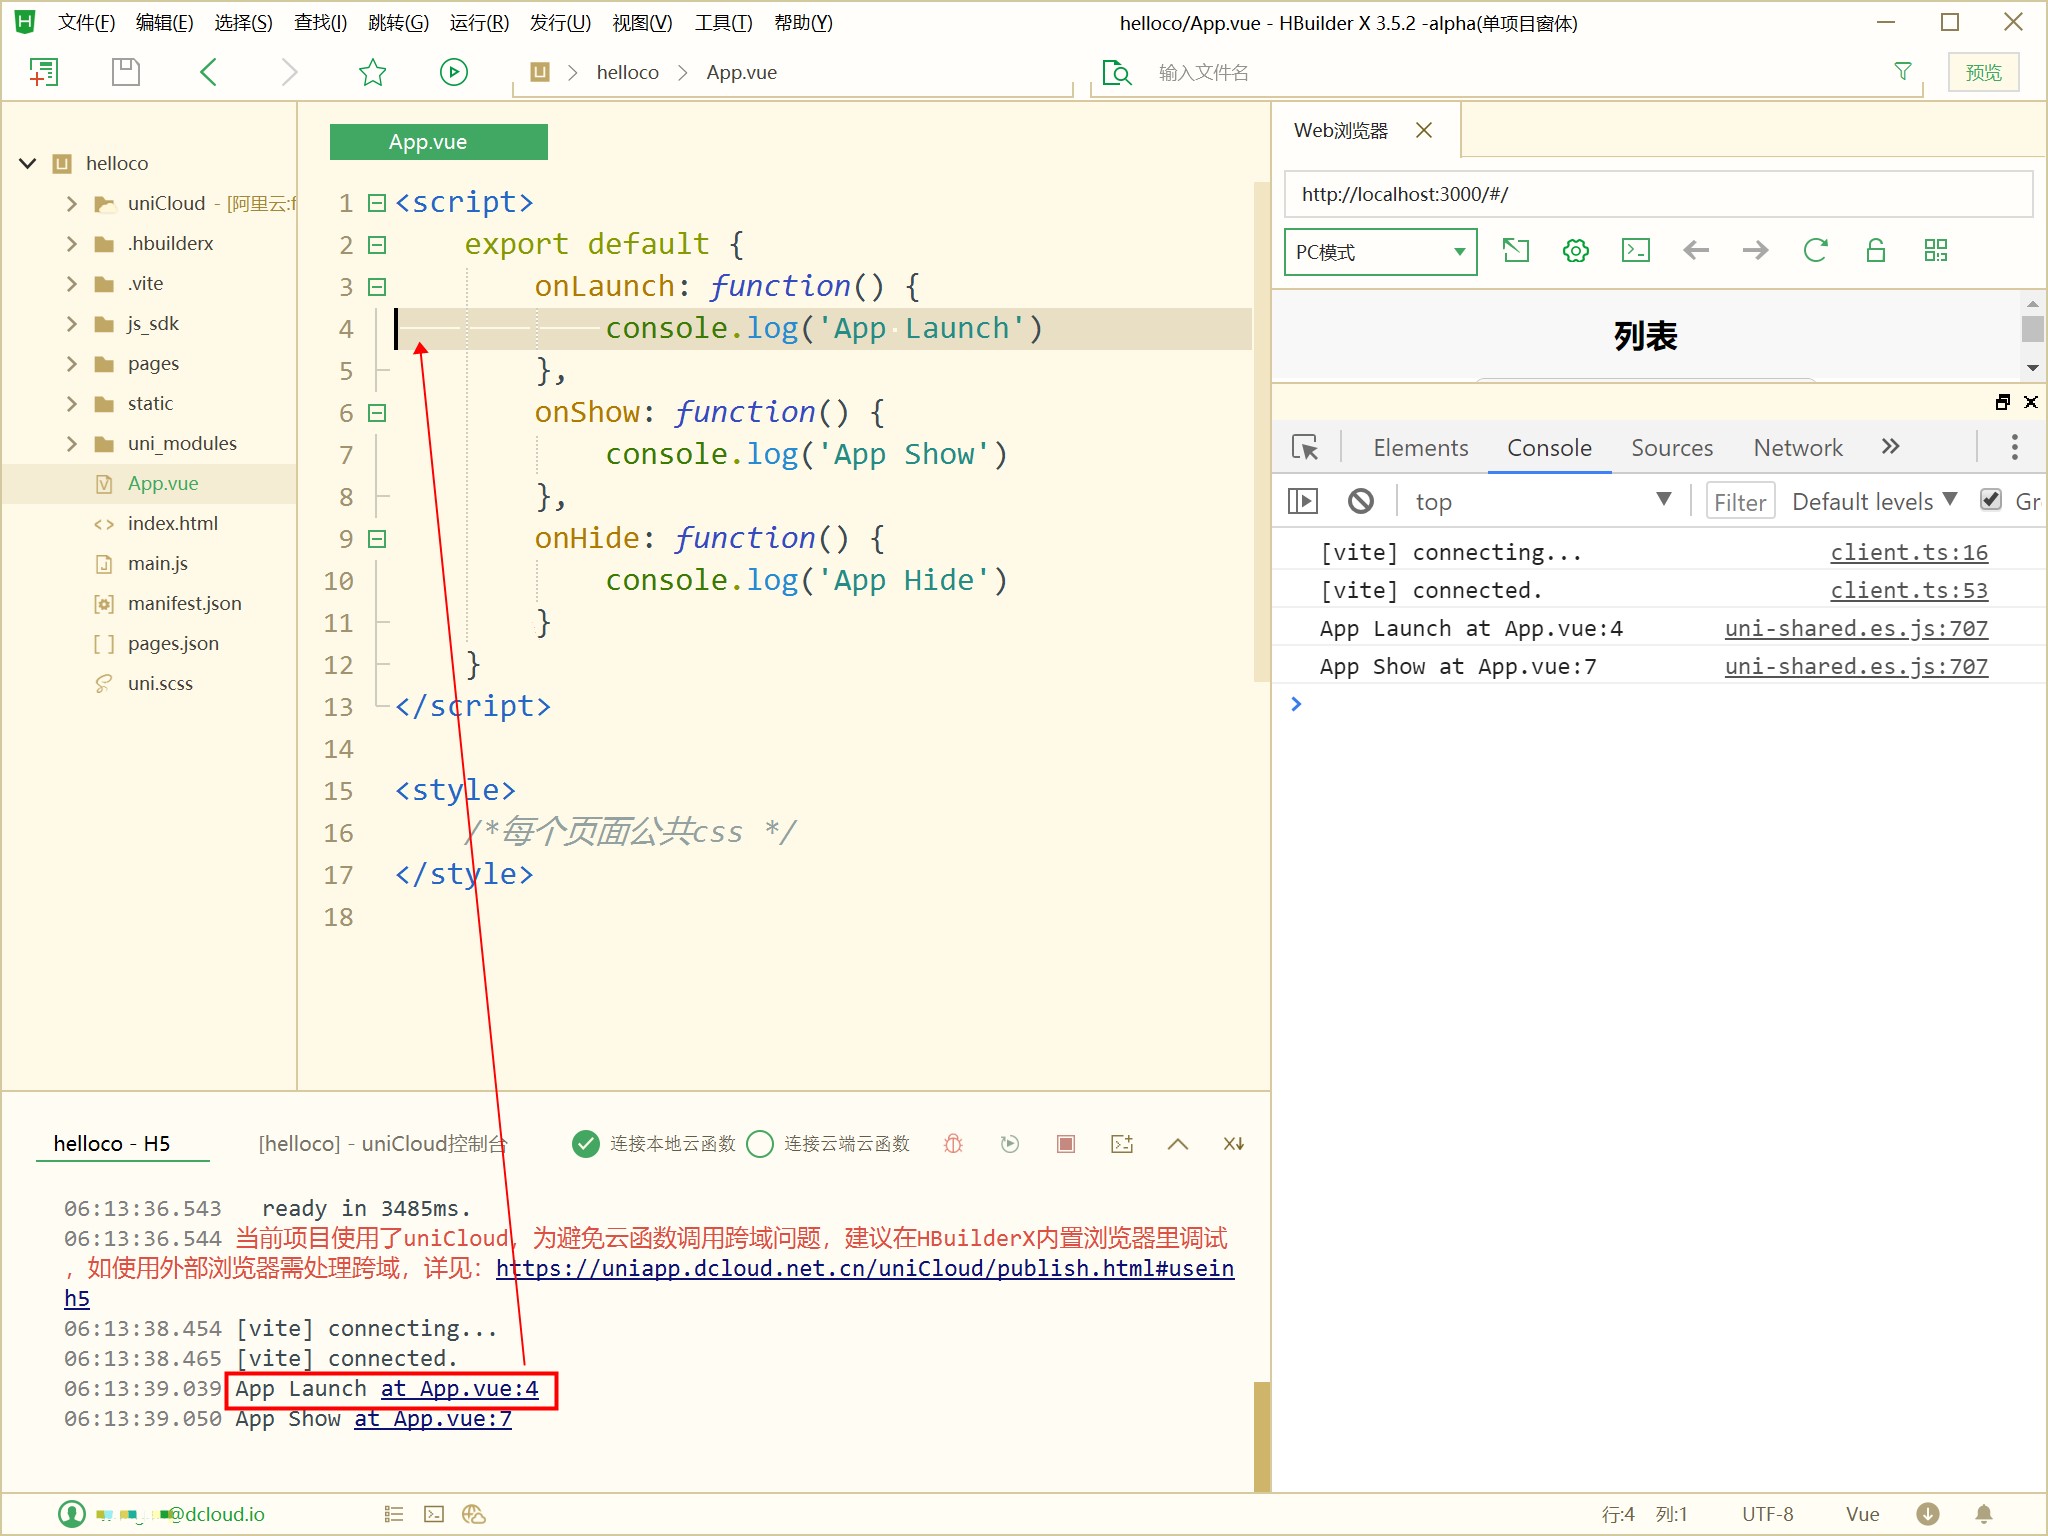
Open the uni-app project page, click the Preview button in the upper right corner of HBuilderX, you can open the web running result in the built-in browser, or you can right-click to open the console debugging.
When modifying and saving the project source code, the content of the browser on the right can be automatically refreshed.
In the HBuilderX console, you can directly see the logs printed by the built-in browser.
Click the log to jump directly to the corresponding code.

Note that the log printed by the browser console cannot be transferred to the code, only the log printed by the HBuilder console can be transferred to the code. Running to an external browser does not have this feature. Only HBuilder built-in browser can.
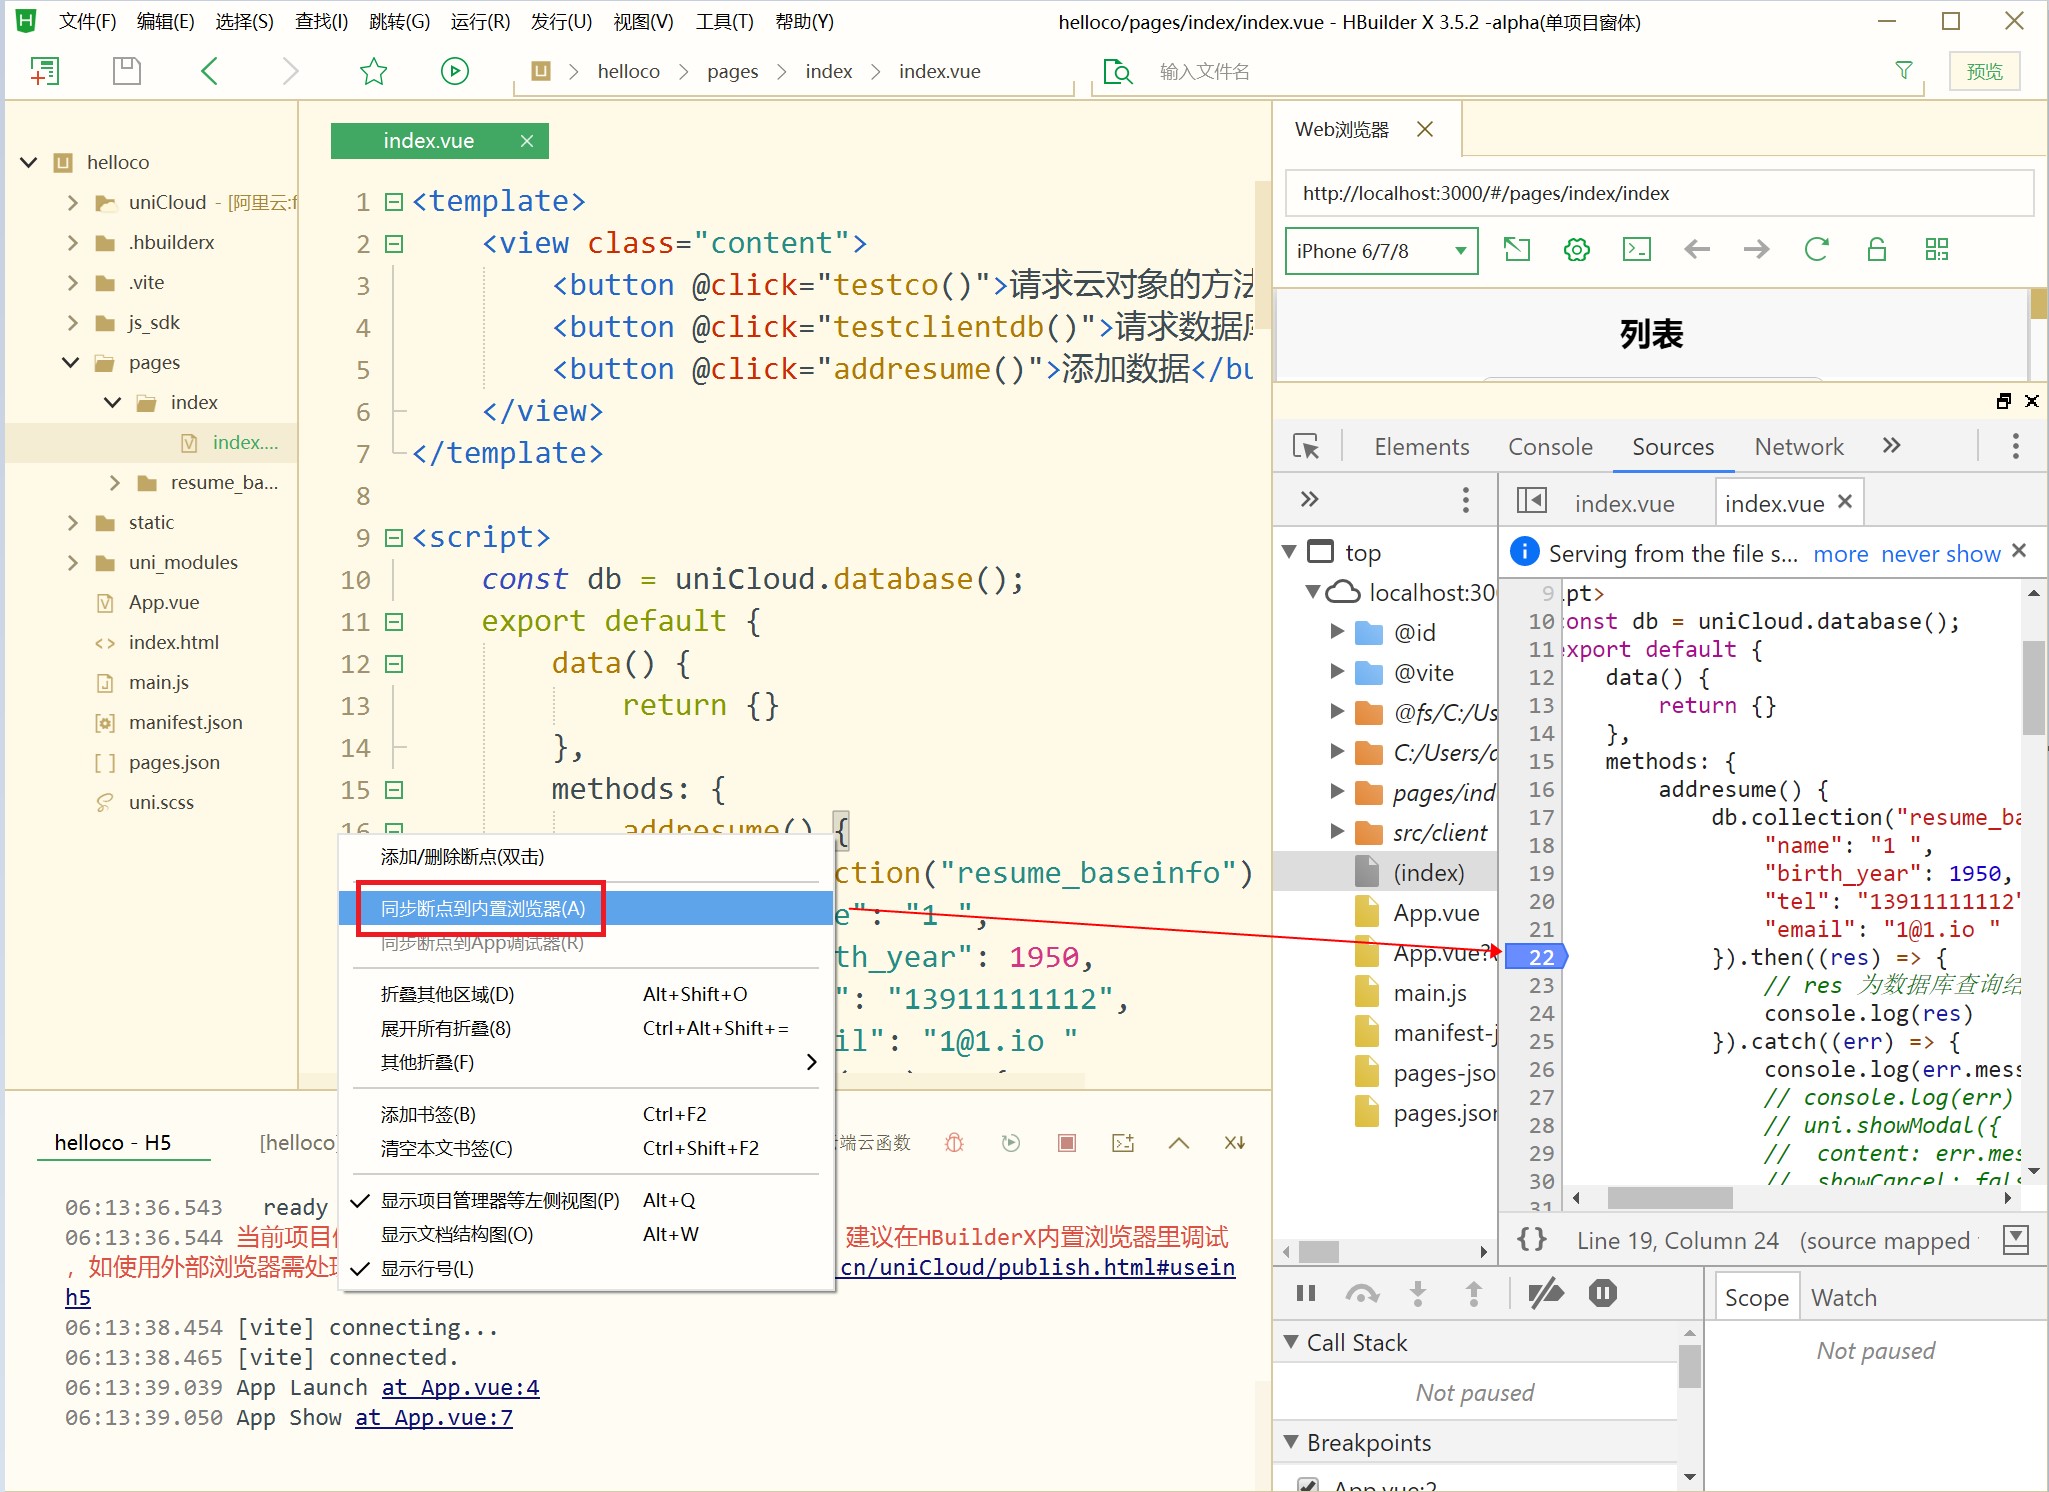
There are two breakpoint debugging solutions in HBuilder, one is to use the debugging console that comes with the browser; the other is to use the debugging console of HBuilderX.
In the HBuilderX built-in browser, the console of the HBuilderX built-in browser can be used. No need to hit the red bug button that runs the console at this point.
Right-click on the source code, you can synchronize the breakpoint to the debugging tool of the built-in browser, and the debugging method is the same as the common usage of chrome.

关于另一种使用HBuilderX的调试控制台的方案,另见