English
English
# App Platform Debugging Guide debug
In conventional development, when you run the app in the run menu of HBuilderX, the errors or console.log log information on the mobile phone will be directly printed to the console.
If you need more functionality, such as inspecting elements, breaking point debug, you need to enable debug mode. Since HBuilderX 2.0.3+ version, App side debugging has been supported.
# Open debug window
In HBuilderX, run the project correctly: Run --> Run to phone or emulator --> Select device, after the project starts, select the debug icon in the console below.
![]()
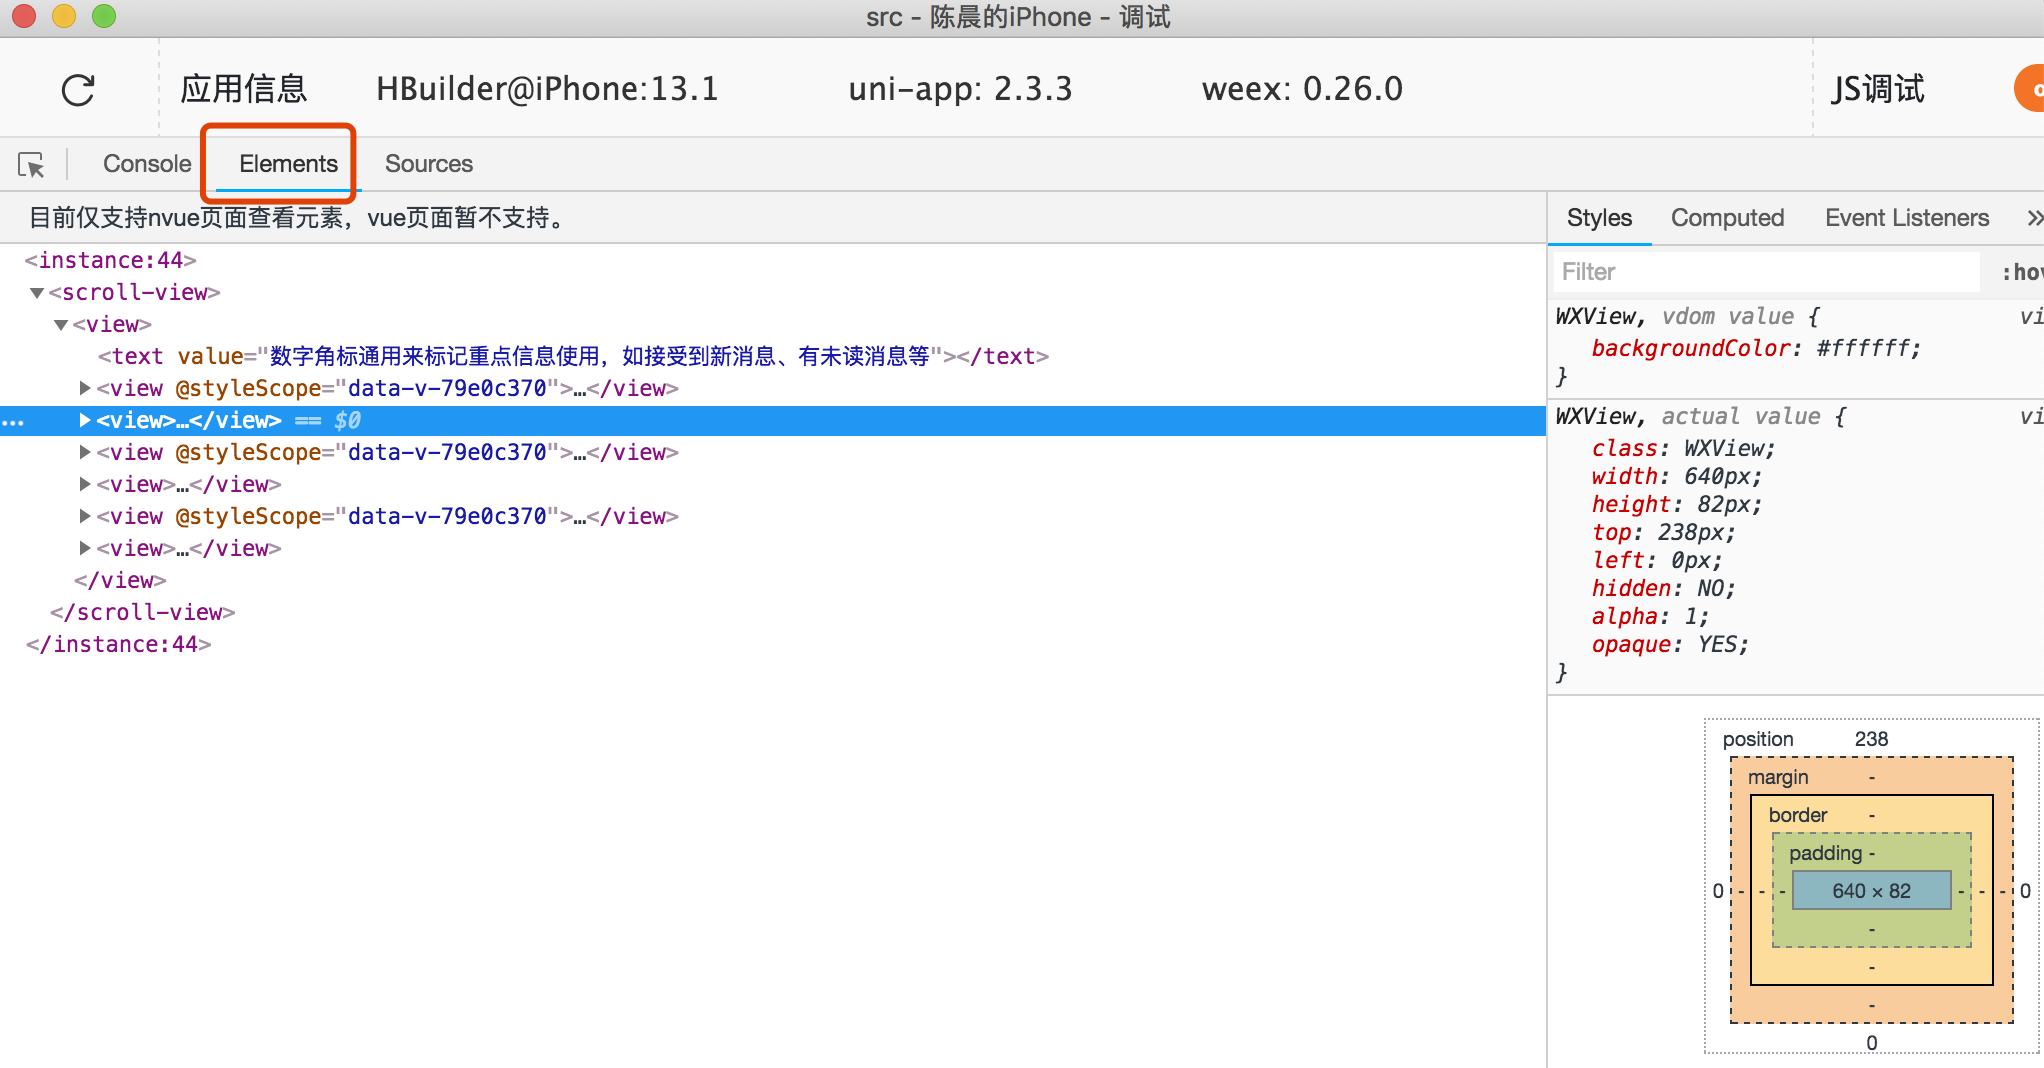
# Elements
# console.log log
console.log is the most commonly used debugging method in our daily development, and of course HBuilderX is indispensable.
The App side provides the
console.loglog output running on the real machine. When running to the real machine or simulator, you don't need to click thedebugbutton to operate the mobile phone, and the log will be output directly on theHBuilderXconsole.If it is more complex logic, it is recommended to use the
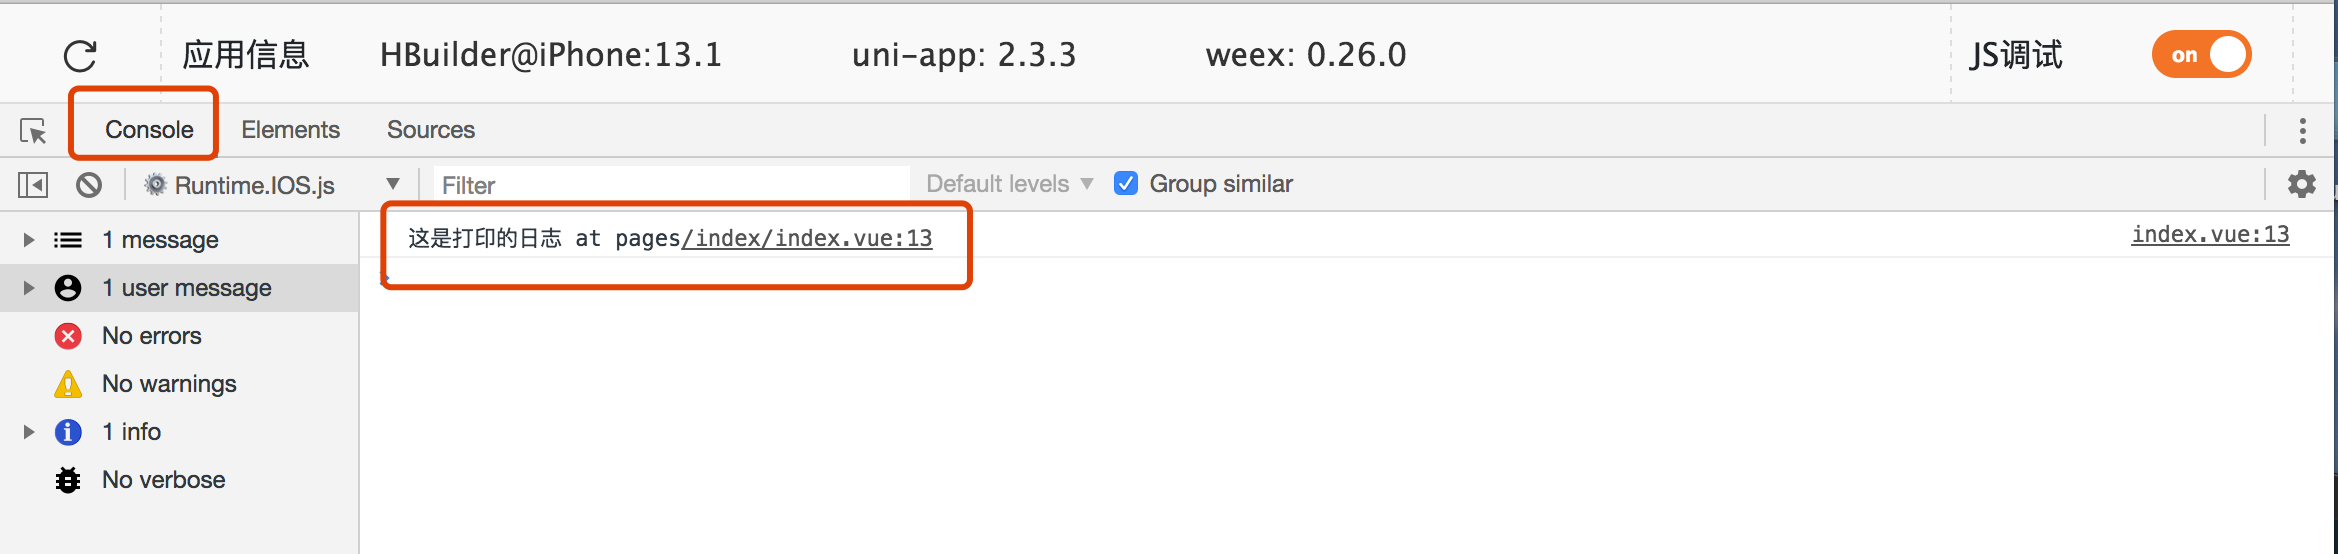
consolein the debugging tool. According to the previous step, after starting thedebugwindow, execute theconsole.logmethod to see the printed content.
The method of viewing console.log in the debug window is as follows:
# Debug page
In the Sources (indicated 1 in the figure) column of the debug window console, you can breakpoint debugging for js.
Find the page that needs to be debugged under uniapp (indicated by 2 in the figure), click Open , and you can see the content we need to debug on the right (indicated by 3 in the figure). Click to place a breakpoint at the position of the line of code that needs to be debugged (indicated by 4 in the figure).
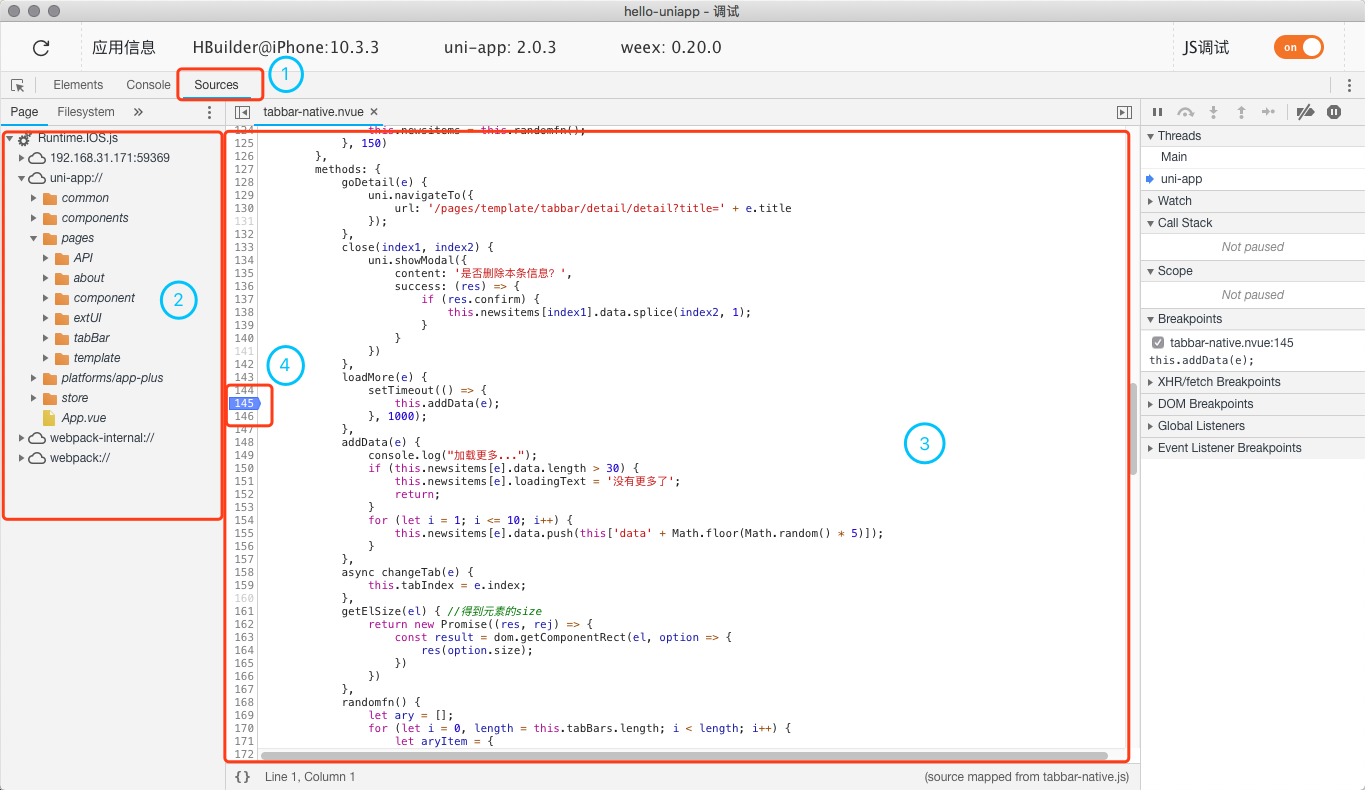
After that, operate on the device and enter the breakpoint position, which is convenient for us to trace and debug the code.
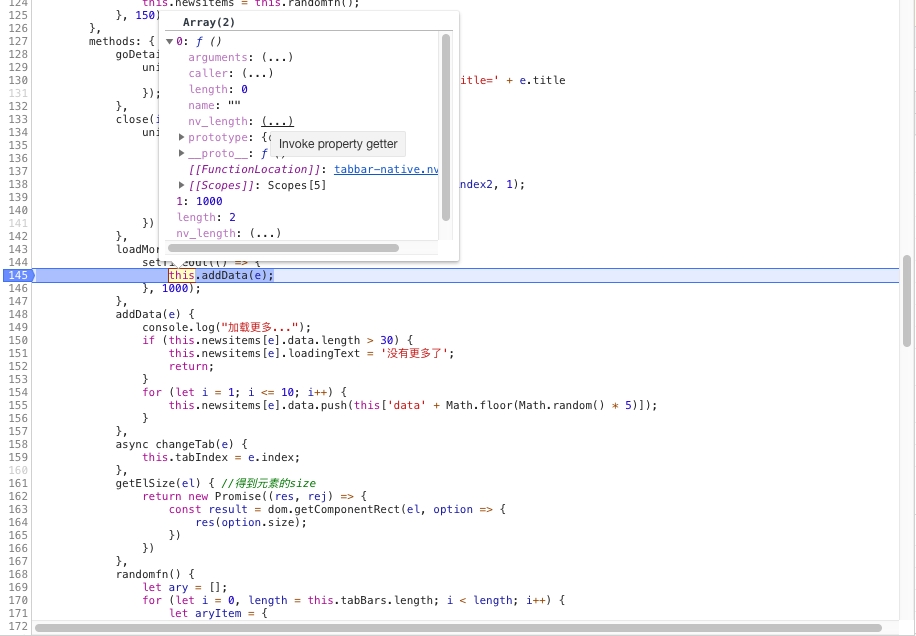
# Synchronize breakpoints to debugger
It is quite troublesome to find the code to be debugged among the many codes in the console. The debugging of HBuilderX also provides a convenient function, which can directly break the breakpoint in the editor, and the breakpoint will be automatically synchronized to the debugging tool .
Operation steps: Right-click on the line number of the target line in the HBuilderX editor, select "Synchronize breakpoint to debugger" in the right-click menu, and then the debugging console will automatically open the corresponding code and mark the breakpoint at the specified line . The demo is as follows:
# Precautions
- Both
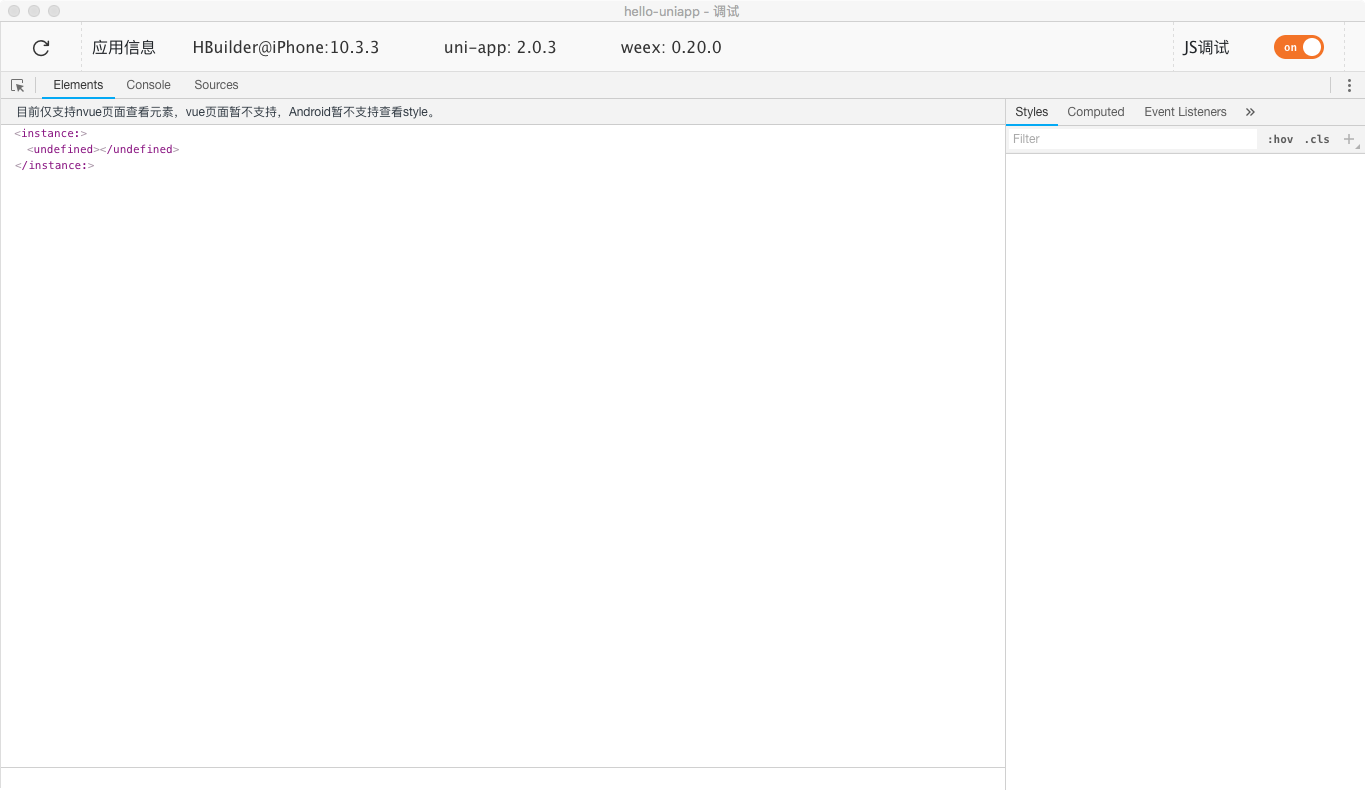
vueandnvuepages support breakpoint debugging - Currently only supports
nvuepage review elements,vuepages are not currently supported, andnvuereview elements on theAndroidplatform do not currently support viewingstyle - The App side provides the
console.loglog output running on the real machine. When running to the real machine or simulator, you don't need to click thedebugbutton to run the mobile app, and the log will be output directly on theHBuilderXconsole. - If you are debugging the interface and general API of
App, it is recommended to compile to the H5 side, click the preview in the upper right corner ofHBuilderX, and callDomin the built-in browser. You can see the results immediately after saving, which makes debugging more convenient. And the H5 side also supports various complex settings oftitleNView. The only thing to pay attention to is the compatibility ofcss. Using too newcssto preview onpcmay be normal, but it is abnormal on low-endAndroid. For details, please checkcaniuseand other websites. - The common development mode is to use the built-in browser preview on
pcto adjust the dom, and run it on the real machine to seeconsole.log. Only usedebugif it is a very complex problem. - The webkit remote debug on the App side of uni-app can only debug the view layer, but not the logic layer. Because the js of uni-app is not running in webview, but in independent jscore.
- Some manifest configurations, such as third-party sdk configurations, need to be packaged to take effect, and a custom runtime base can be packaged. After packaging the custom base and running this custom base, you can also run and debug the real machine. Packaging the official package will not be able to run and debug the real machine.