

English
uni统计2 是开源、全端、云端一体、更适合uni-app的统计平台。
欢迎加入uni统计2.0技术交流群
Experience system: https://hellouniadmin.dcloud.net.cn/
注:uni统计内置在uni-admin中,体验系统的数据会定期重置。
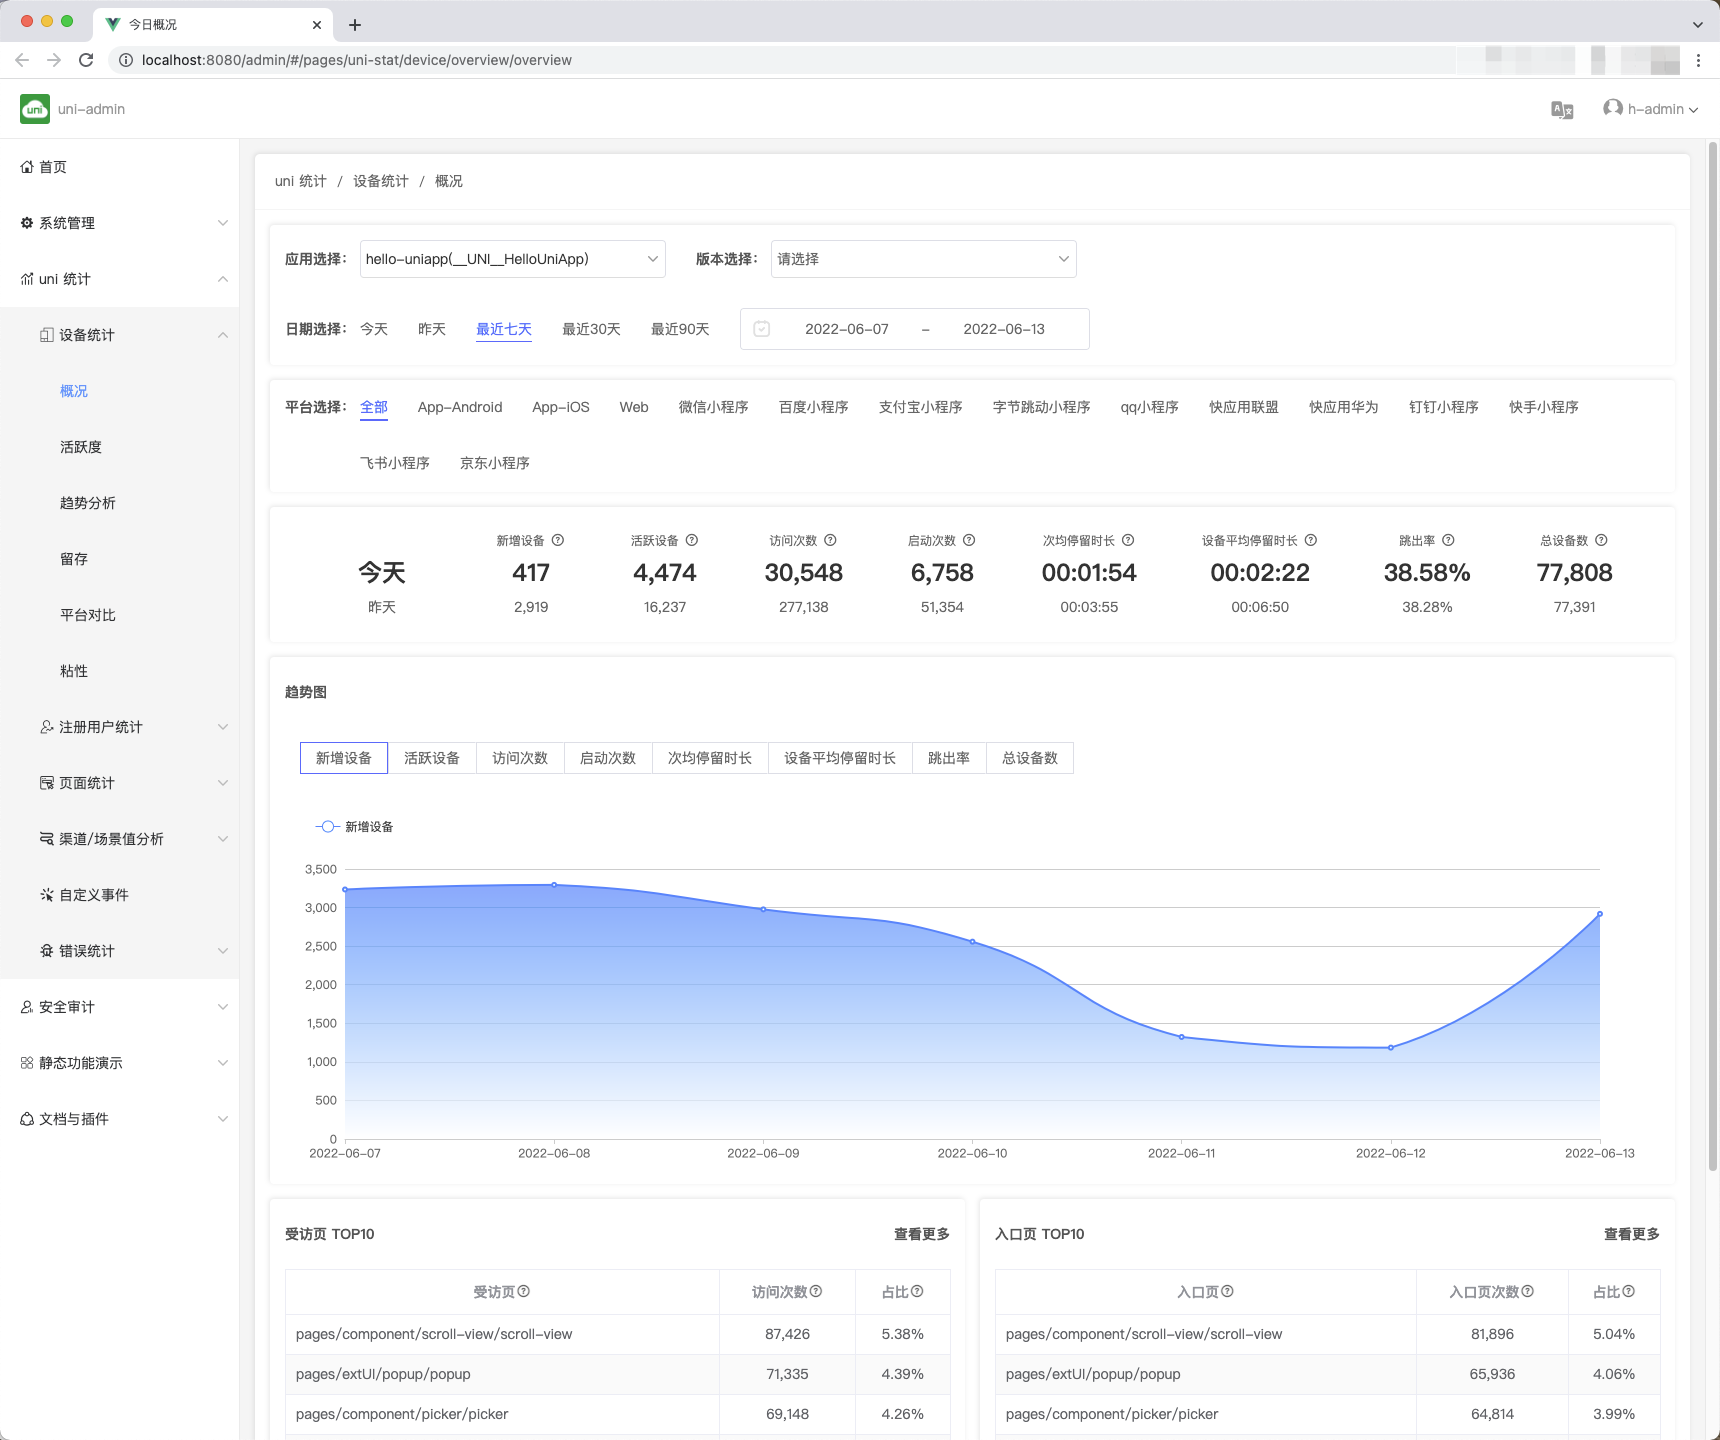
无需开发,在manifest的 uni统计 中打勾并发行,在uniCloud服务空间部署uni-admin,即可查看报表。
At the same time, developers can also customize the management data and customize the display report.
1. Full end
Full-end traffic statistics, one report can view the operation data of all devices (iOS, Android, Web and various MiniApp).
There is no need to connect different SDKs at each end, and there is no need to view data in different reports. At present, there is only one solution known in the market that can see the business panorama in one report.
2. Open source, free, free to customize
All codes are open source. What data to collect can be customized; batch running frequency can be customized (real-time statistics can be done during activities); display reports can be customized.
3. Private deployment, data automatic control
Using traditional saas statistical products, all data are reported to statistical service providers.
uni Statistics 2.0 is implemented based on uniCloud, cloud functions and statistical data are all hosted in the developer's own service space (Alibaba Cloud or Tencent Cloud optional), and developers have complete control over their own statistical data.
4. Effective Error Analysis
Traditional App statistics platforms do not have js error statistics. Developers cannot know on which devices their js code will report errors.
The error information of uni statistics is more comprehensive, including js front-end errors and app native layer crashes.
Because uni-app runs after compilation, the traditional web and MiniApp statistics platform, its js error cannot be traced back to the pre-compiled source code of uni-app, and the error is incomprehensible.
Uni statistics support sourcemap, which can intuitively understand which line of code is wrong. See details
5. Default feature rich
6. More suitable for uni-app and uniCloud
uni statistics goes deep into the bottom layer of uni-app and uniCloud framework, and provides many functions that other statistics platforms cannot provide:
7. Open Ecosystem
uni统计的开源且基于uni-admin的插件规范提供了插件机制,会有更多插件作者提供各种丰富的统计插件(如电商统计、内容统计等)。见插件市场
**DCloud attaches great importance to the growth of data-driven developer business. Recently, it has cooperated with professional big data service providers Sensors and Aladdin will jointly improve the product modules and ecological construction of Uni Statistics 2.0. If you have any needs for data analysis, you are welcome to fill in the demand survey, we will Based on your valuable suggestions, we will complete the iterative update based on the original Uni statistical products. **
For developers using uni stats 1.0, it is recommended to upgrade to uni stats 2.0 as soon as possible. uni stats 1.0 will no longer be updated and maintained.
| Functions | uni stats 1.0 | uni stats 2.0 |
|---|---|---|
| Whether Open Source | No | Yes |
| Deployment | Central Deployment | Private Deployment |
| Customization | Cannot be customized | Free customization |
| uni-id user statistics | excludes | included by default |
| Error Analysis Effectiveness | Lower | Higher |
uni stats 2.0 includes two modules:
uni-app framework and configured in the manifest.json of the business app;uni-admin project template, reuses the same uniCloud service space as the business app;In the manifest.json of the business app project, select the uni statistics configuration item, select to enable uni statistics as required, and check 2.0 to enable the new version of statistics.
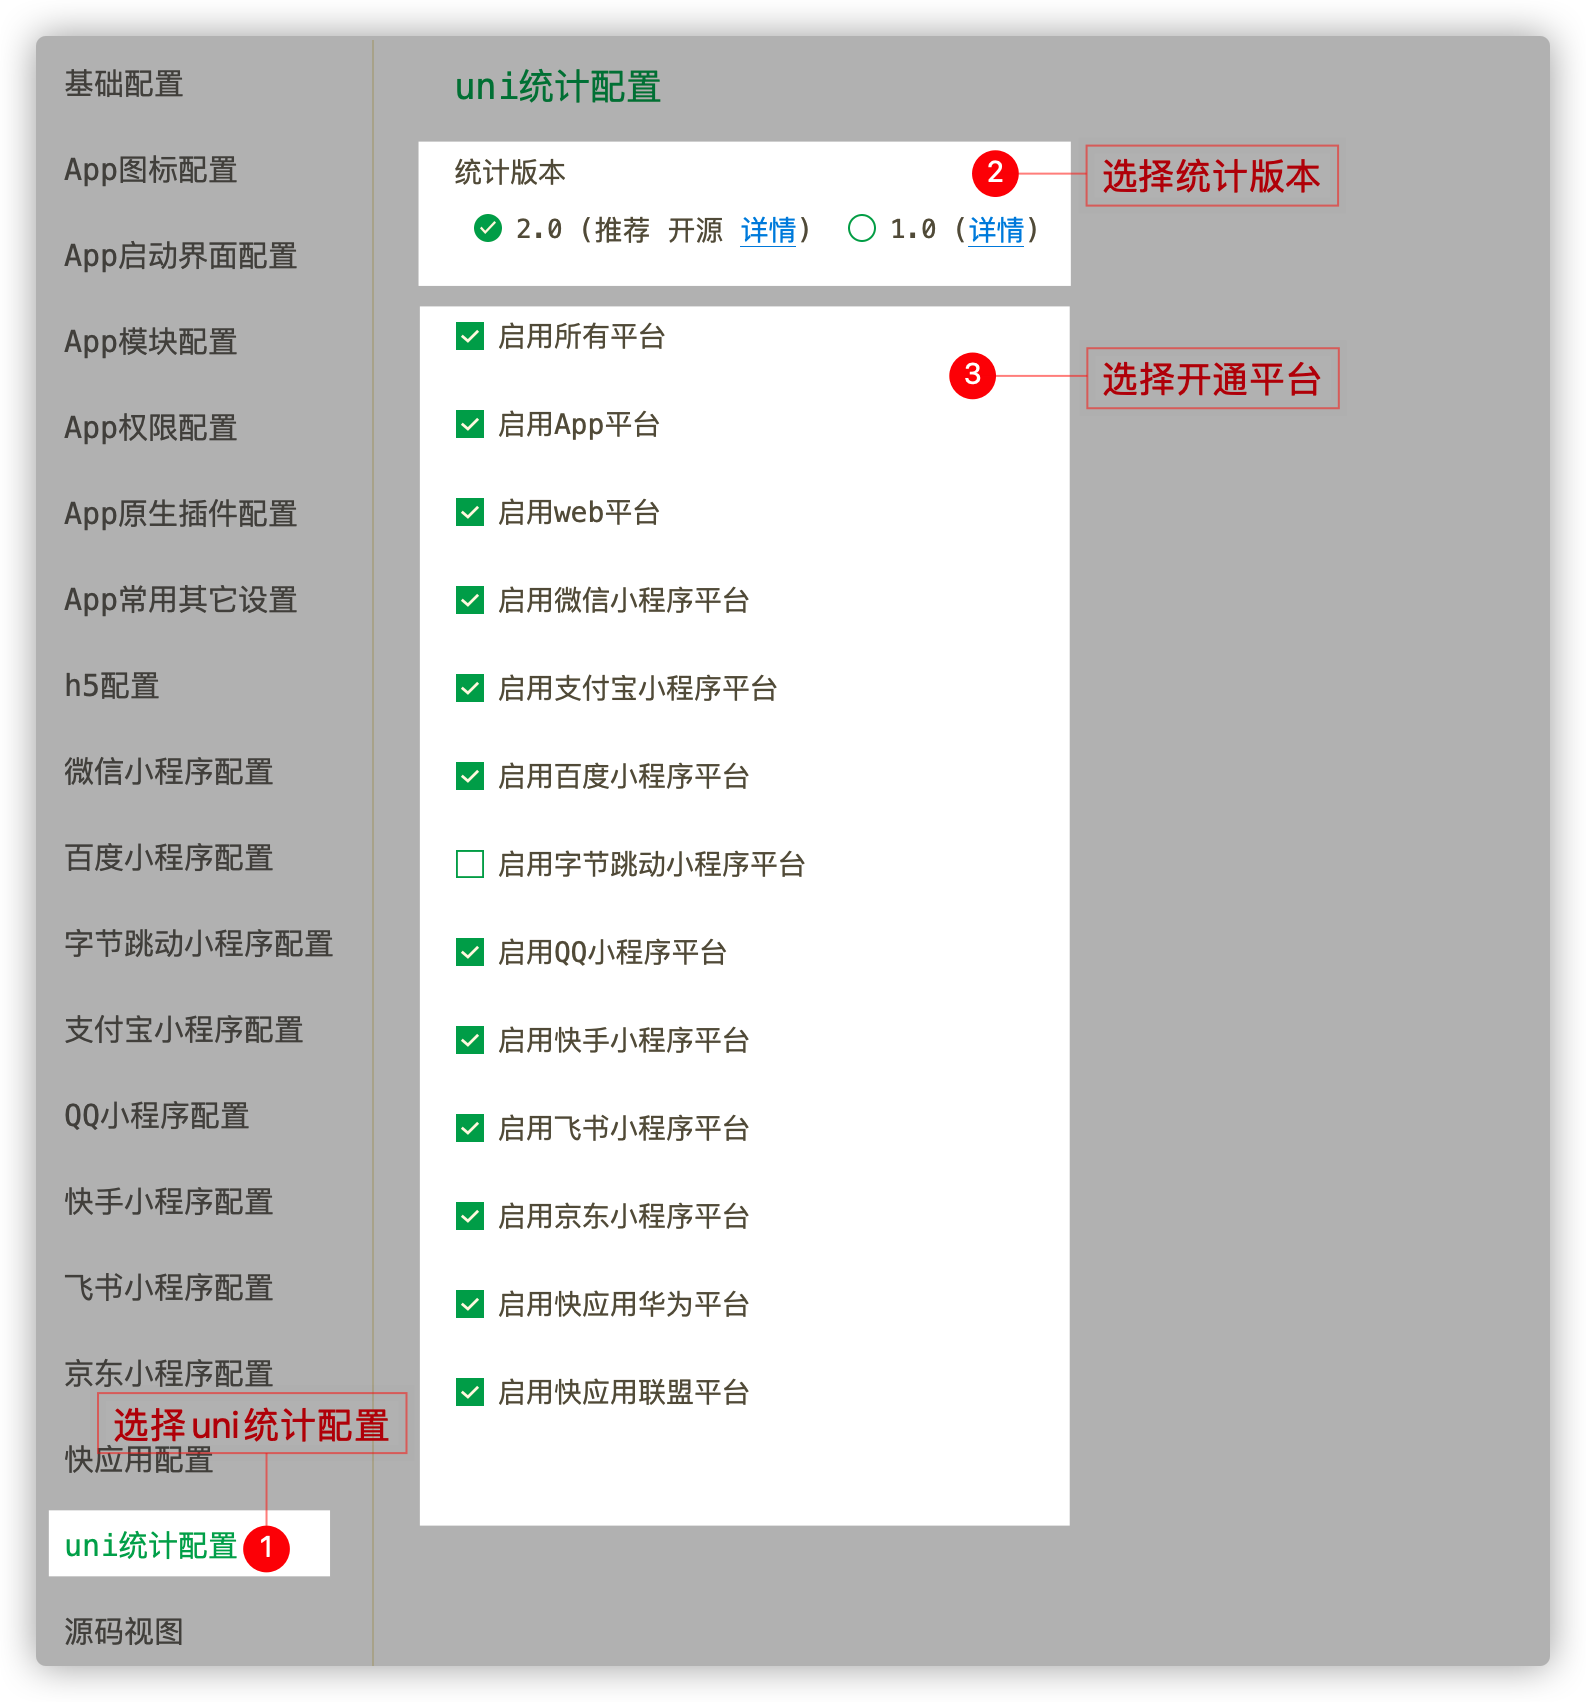
The above visualization operations actually correspond to the uniStatistics node of the manifest source view. The manifest specification is detailed in the following document. If you don't care about the specification details, you can skip this section and continue to read the next section "MiniApp Domain Name Whitelist".
The enable field under uniStatistics is set to true|false to enable and disable uni statistics
Set the version property to "2" to enable new version statistics
//...
"uniStatistics": {
	"enable": true,//全局开启
},
//...
uniStatistics description
| Field | Type | Default Value | Optional Value | Description |
|---|---|---|---|---|
| enable | Boolean | false | true , false | Enable or disable statistics globally, the sub-platform configuration will override the current configuration |
| version | String | "1" | "1" , "2" | Statistical version, if not filled in, the default version 1.0 is used, and the 2.0 version is recommended |
| debug | Boolean | false | true , false | Enable statistical debugging mode, a large number of logs will be generated, and data will be reported during the development stage. Please turn off this option when the application is released |
| reportInterval | Number | 10 | - | Front-end data reporting period HBuilderX 3.5.4+ support |
| collectItems | Object | - | - | collection item configuration HBuilderX 3.5.5+ support |
collectItems collection item configuration description
| Field | Type | Default Value | Optional Value | Description |
|---|---|---|---|---|
| uniPushClientID | Boolean | false | true/false | 是否开启推送PushClientID的采集 |
| uniStatPageLog | Boolean | true | true/false | 是否开启页面数据采集, |
Sub-platform settings
uniStatistics 支持分平台设置,比如仅开启微信小程序平台的 uni统计,则在 manifest.json mp-weixin节点下设置 uniStatistics ->enable 即可,如下:
{
	//...
	"mp-weixin":{
			"uniStatistics": {
			}
	}
}
Description of uniStatistics by platform
| Field | Type | Default Value | Optional Value | Description |
|---|---|---|---|---|
| enable | Boolean | false | true , false | Enable or disable statistics by platform, the configuration of each platform will override the global configuration, uniStatistics needs to be under the platform configuration |
attention
uniStatistics -> enable field under a sub-platform, the configuration under the sub-platform will be used first, otherwise, the global statistics setting will be usedversion and debug properties on different platforms, and the two properties only take effect globallydebug attribute on different platforms, this attribute only takes effect globallyBecause each MiniApp needs to configure a whitelist for accessible domain names, otherwise it will not be able to connect to the Internet. Therefore, when the MiniApp needs to be released, it is necessary to configure the domain name whitelist in the MiniApp management background of each manufacturer.
When deploying uni statistics, you can choose to use the Alibaba Cloud version or Tencent Cloud version of uniCloud. The domain names corresponding to different cloud vendors are different (there will be service space related configurations in the later chapters of the article)
点击查看各厂商request合法域名。
According to the selected uniCloud cloud vendor, you can configure the corresponding domain name in the domain name whitelist configuration of the MiniApp.
Notice
api.bspapp.comSet the debug field under manifest.json -> uniStatistics to true|false to enable and disable the uni statistics debug mode
In debug mode, the key information of the reported data will be printed to the console, which is convenient to observe whether the collected information is correct. It is mostly used when customizing extensions.
Log format
=== indicates statistics log related logs
// mark statistics on
=== uni统计开启,version:2.0

// Collect logs, see collection type: Description of reported data
=== 统计数据采集:{采集类型} ===
// here is the raw data collected
{
	fvts: 1647313662
	lang: "zh"
	lt: "1"
	lvts: 1650857441
	md: "PC"
	t: 1650857461
	ttpj: "view"
	tvc: 14
	url: "pages/component/view/view"
	usv: "0.0.1"
	ut: "h5"
	// ...
}
=== 采集结束 ===

// data reported successfully
=== 统计队列数据上报 ===
// here is the report data
{usv: '0.0.1', t: 1650857765, requests: '["lt=11&ut=h5&url=/pages/component/view/view&tt=&u…&ch=&usv=0.0.1&t=1650857765&ttn=&ttpj=view&ttc="]'}
=== 上报结束 ===
For the description of log fields, see Front-end Collection SDK
The background statistics report of uni statistics 2.0 is a built-in plugin of uni-admin.
uni-admin is an open source management background. That is, to use uni statistics 2.0, you need to install this background system, find the menu of uni statistics and use it.
Currently, there are two ways to install uni-admin: one-click deployment and manual installation.
一键部署uni-admin仅需要前往插件市场搜索找到uni-admin插件后,选择进入uni-admin插件详情页并点击在线体验/部署按钮,选择部署在我的服务空间,然后选择需要部署uni-admin项目的服务空间后耐心等待系统自动部署完成即可。
Manually install uni-admin, please refer to [uni-admin](https://uniapp.dcloud.io/uniCloud/admin.html#uni-admin-%E6%A1%86%E6%9E%B6-% E5%8E%9F%E5%90%8D-unicloud-admin) document, complete the following operations:
uni-admin project (select the uni-admin template in the HBuilderX new project interface)db_init.json. If the previous table already has conflicting data, you need to manually merge it yourselfuniCloud/cloudfunctions/common/uni-config-center/uni-id/config.json file (used for encrypted password storage key) and tokenSecret fields (to generate the secret key required for token generation, you can also skip this item during the test), then right-click on the uni-config-center public module to upload the update. Note: When the business-side App project and the report-side uni-admin project are associated with the same service space, the mutual coverage problem of uni-config-center may occur. In this case, single-point maintenance is recommended. See details.uni-admin page after running (if you can't see the data, see the FAQ section below)uni-admin project in the HBuilder issue menu, and choose to deploy it to the front-end web hosting of the uniCloud service space. You can customize the domain name in the uniCloud web console.attention
db_init initialization data was missed in the service space initialization wizard before, right-click on uniCloud/database/db_init.json to initializeuni-admin old project upgrade
If the business you need to count has used uni-admin before, you can upgrade uni-admin. Right-click package.json under the project and select "Update from Plugin Marketplace".
The newly added files of uni statistics mainly include:
uniCloud/cloudfunctions/uni-stat-cron (run and batch cloud functions regularly), uniCloud/cloudfunctions/uni-stat-receiver (receive cloud objects processed by the front end)uniCloud/cloudfunctions/common/uni-statschema files at the beginning of uni-stat in the uniCloud/database directorypages/uni-stat folderWhen updating, please merge pages.json to ensure that all new pages are registered successfully. Otherwise, after running, clicking on the left menu will report that the xxx file cannot be found.
When db_init.json initializes the database, the menu table opendb-admin-menus of the old project already has data. At this time, the data with conflicting keys cannot be inserted and need to be merged manually.
In uni statistics 2.0, the default trigger period of the timed task cloud function (uni-stat-cron) is to trigger every hour (ie: every 1 hour, the system will automatically trigger the uni-stat-cron cloud function ).
You can modify the trigger period of the Scheduled Task Cloud Function (uni-stat-cron) to the minute level (that is, every n minutes) as needed, but pay attention to the modification of the trigger period, you need to ensure that Scheduled Task Configuration Item whether the number of minutes set in ) will be triggered, for example, your configuration item is set to trigger on the 10th minute of every hour (expression: * * * 10), while the timing trigger is set to trigger every 20 minutes 1 time (0 1/20 * * * * *), then this configuration item will never be triggered.
注意
cronMin parameter to true.package.json file under the Scheduled Task Cloud Function (uni-stat-cron). For the specific description of the timing trigger, please refer to the official document [Timing Trigger](https ://uniapp.dcloud.io/uniCloud/trigger.html)."cloudfunction-config": {
"concurrency": 1,
"memorySize": 256,
"timeout": 600,
"triggers": [
{
"name": "uni-stat-cron",
"type": "timer",
}
]
}
cron parameter in the configuration file (config.json) will be triggered.Scheduled Task Cloud Function (uni-stat-cron) and Configuration Center (uni-config-center).After enabling the redis cache, it can reduce the database query pressure and improve the uni statistical performance. You can decide whether to enable it on demand.
attention
Before enabling the redis cache, you need to confirm whether the redis service has been purchased in the service space where uni statistics are deployed. If not, you need to purchase the redis service first.
Open steps:
redis parameter to true.package.json file under the data Report data receiver (uni-stat-receiver) and Scheduled task cloud function (uni-stat-cron) respectively.Report data receiver (uni-stat-receiver), Scheduled task cloud function (uni-stat-cron) and Configuration center (uni-config-center).Configure the redis extension library of uni-stat-receiver
Configure the redis extension library of uni-stat-cron
{
	"name": "uni-stat-receiver",
	"dependencies": {
		"uni-id": "file:../../../../uni-id/uniCloud/cloudfunctions/common/uni-id",
		"uni-stat": "file:../common/uni-stat"
	},
	"extensions": {
		"uni-cloud-jql": {},
	}
}
In order for the data collected by the client app to be correctly received and counted by the cloud function in uni-admin, it is necessary to ensure that the client project and the admin project are associated with the same service space.
uniCloud,右键并选择 创建uniCloud云开发环境 -> 支付宝云|阿里云|腾讯云(数据量大推荐使用支付宝云);否则,进入第3步;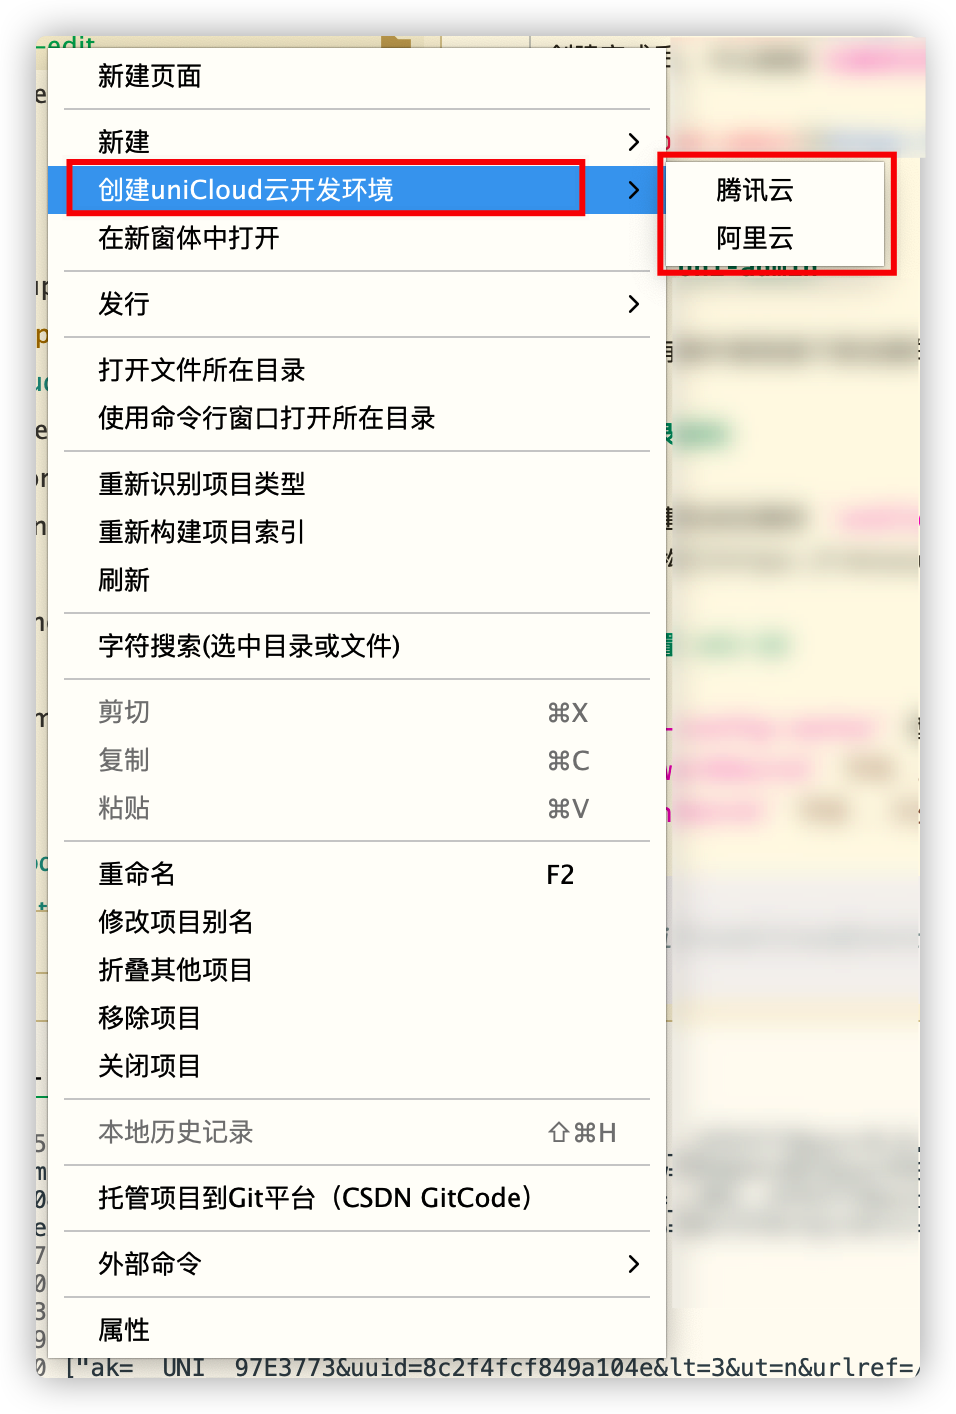
uniCloud directory and select Associate cloud service space or project, and select the service space associated with the uni-admin project in the opened window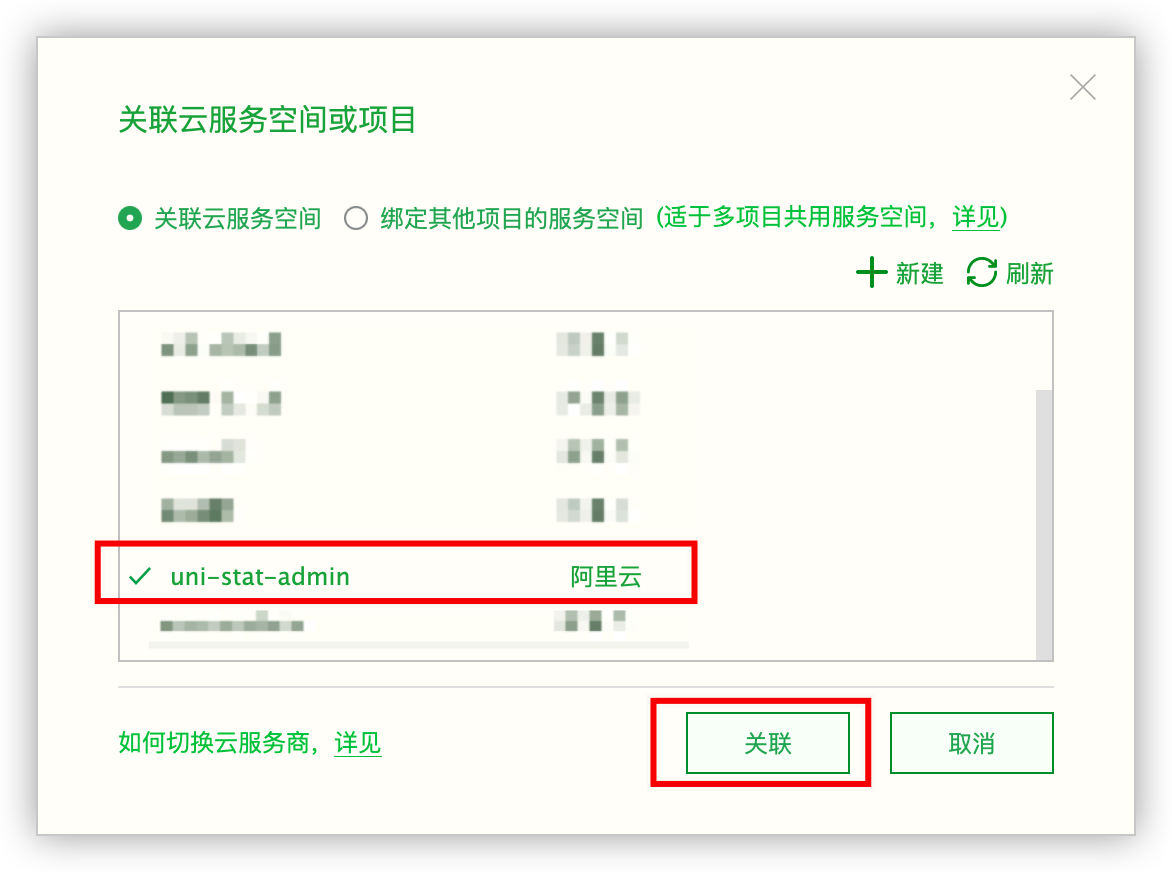
This function only supports web platform, App platform, WeChat MiniApp platform
In order to facilitate developers to use sourceMap files to locate code problems, the error analysis function of using sourceMap in statistics has been added.
The online running terminal may report errors in various user environments, which require statistics and analysis by developers. However, the three-party statistical system (such as Youmeng, Aladdin, and Baidu) collects the error reports on the running side, and it prompts the number of error lines in the code compiled by the uni-app compiler, which is equivalent to garbled characters, and cannot tell the developer that it is uni-app Which line of code in vue or js reports an error.
The sourceMap function of uni statistics can solve this problem. In the statistics background, you can clearly see the error reporting environment and accurate error code, which is the specific information of vue or js before uni-app compilation.
Generate sourceMap file in HBuiderX
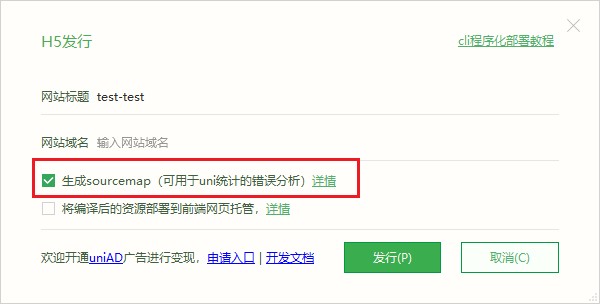
For the web platform, check the Generate sourceMap option in Release -> Website.
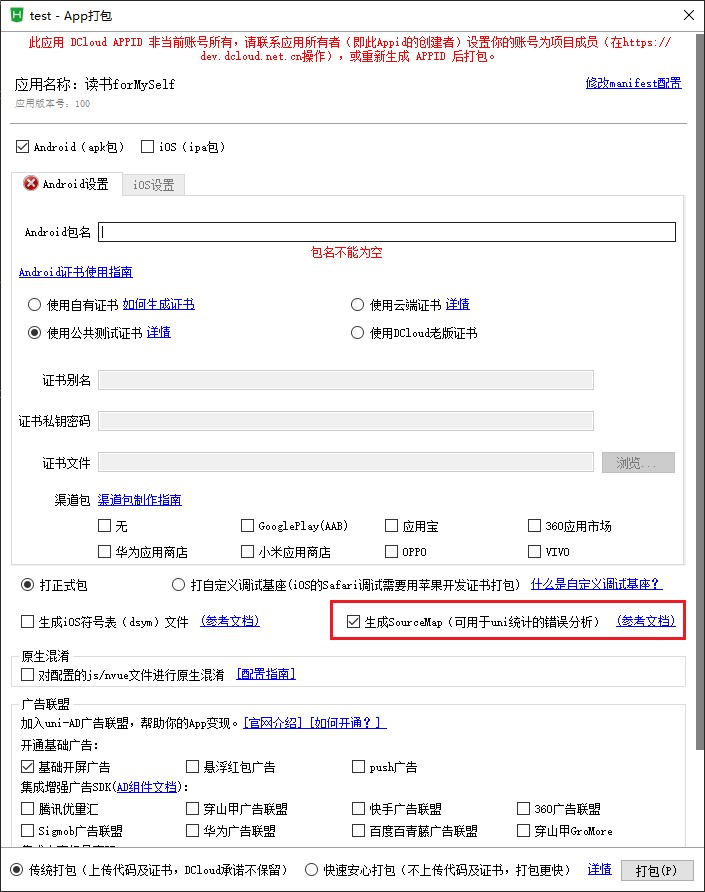
When the App platform is Release -> Native App-Cloud Packaging, check the Generate sourceMap option.
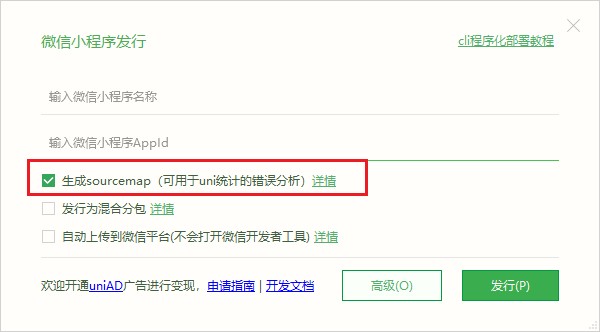
When the WeChat MiniApp platform is Issue -> MiniApp- WeChat, check the Generate sourceMap option.
cli project generates sourceMap file
Vue2
Vue3
yarn build:h5 --sourcemap

yarn build:app-plus --sourcemap

yarn build:mp-weixin --sourcemap
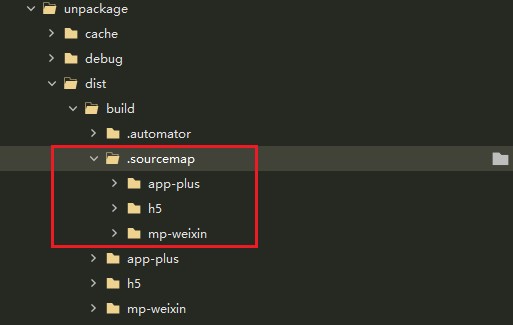
After the project is compiled, you can view the generated sourceMap files for each platform in /unpackage/dist/build/.sourcemap.
After the WeChat MiniApp platform is uploaded and released, it will be compressed and packaged again, so an additional step is required:
Development Management/Operation and Maintenance Center/Error Log of WeChat Public Platform./unpackage/dist/build/.sourcemap/mp-weixin/__WEIXIN__/ (WEIXIN is the newly created directory, and the parsing error will be based on this name lookup)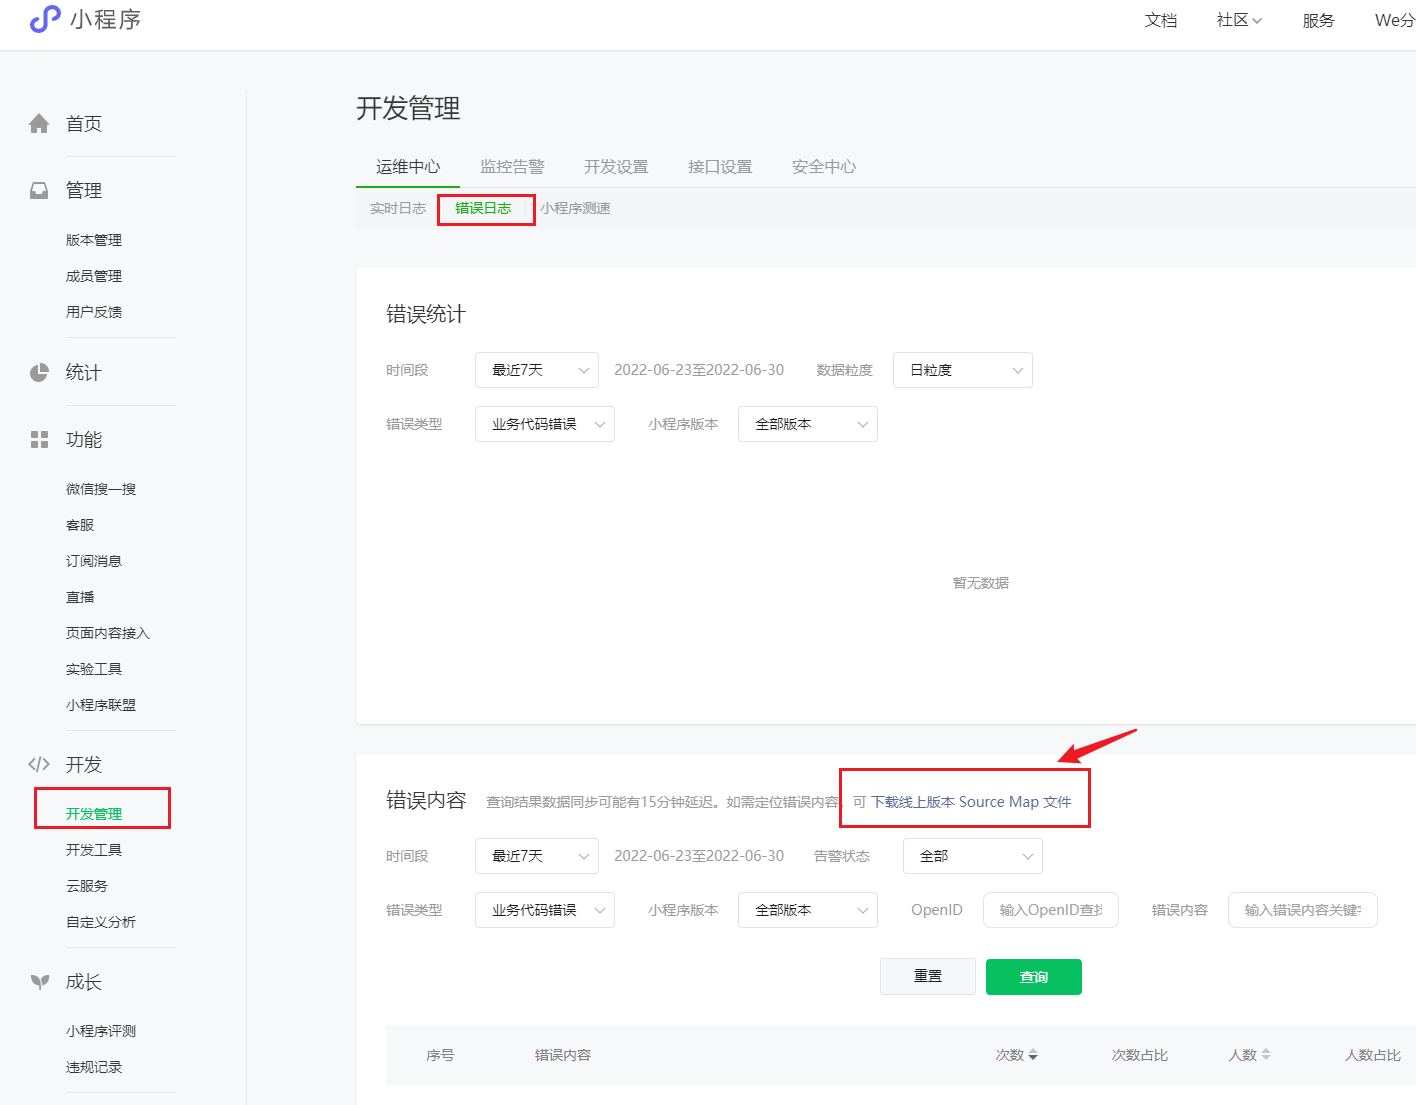
Precautions
__FULL__ folder in the downloaded sourceMap file, please rename it to __APP__release mode sourceMap file error parsinguni-admin 2.3.4+ 版本
注意:2.3.4+ 的版本同时支持阿里云和腾讯云空间。
将 uni-admin 项目运行到浏览器中,在 uni 统计 / 错误统计 / js报错 页面,错误信息列表表格的右上角有 上传 sourceMap 按钮。点击后展示如下:
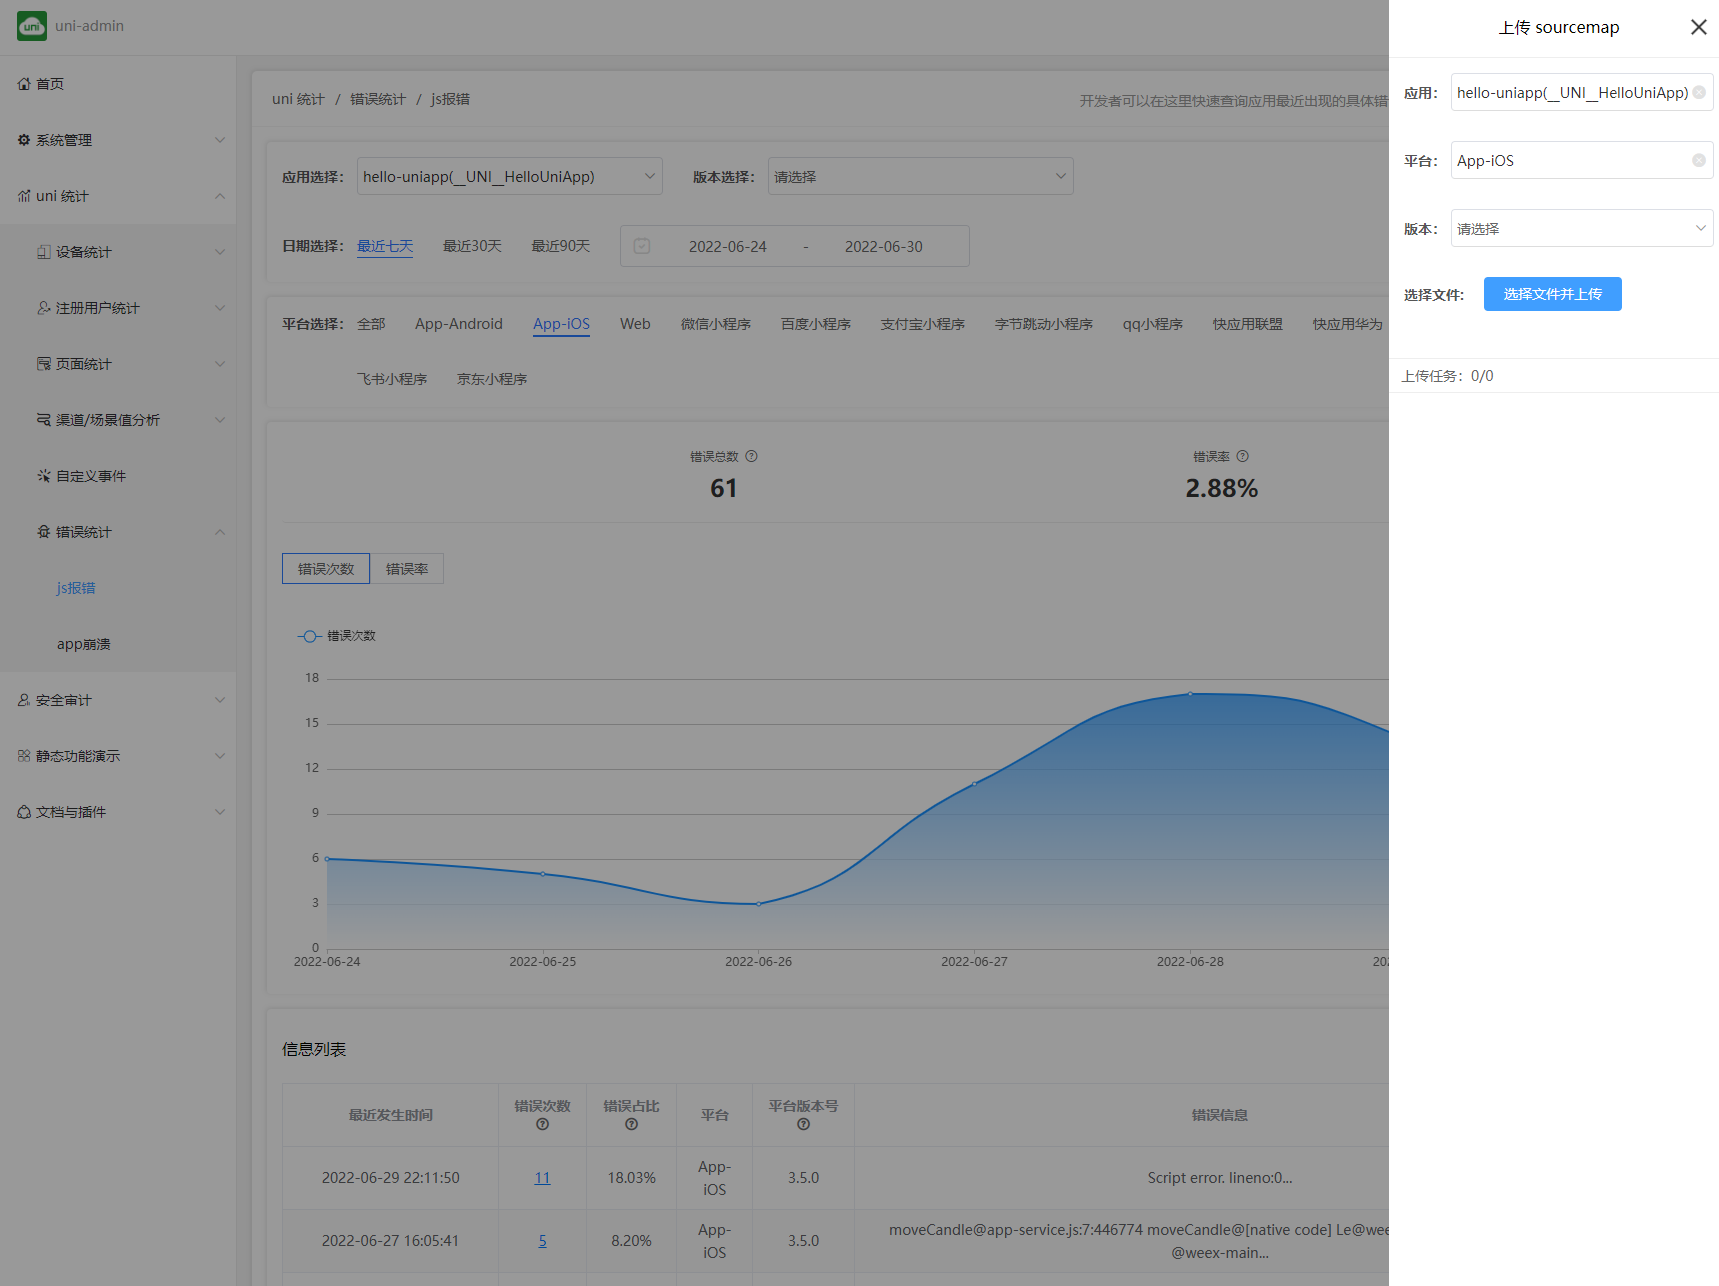
上传请前请填写完整信息:应用、平台、版本
点击 选择文件并上传 按钮,弹出 选择文件夹 框后,请选中编译的对应该平台版本的 sourceMap。如:项目根目录/unpackage/dist/build/.sourcemap/h5,选中 h5 目录后点击上传。如果中途上传失败,在不刷新页面的情况下,重新选择文件夹上传可以跳过已上传文件。
上传完成
uni-admin 2.3.4 之前的版本
注意:2.3.4 之前的版本只支持腾讯云空间,不支持阿里云空间。
Configure uni-stat related information in uni-admin project/admin.config.js:
uploadSourceMapCloudSpaceId to supplement Tencent Cloud Service Space SpaceIDcloudSourceMapUrl to supplement Tencent Cloud cloud storage access address (eg: https://xx-xx-xx.tcb.qcloud.la/__UNI__/uni-stat/sourcemap)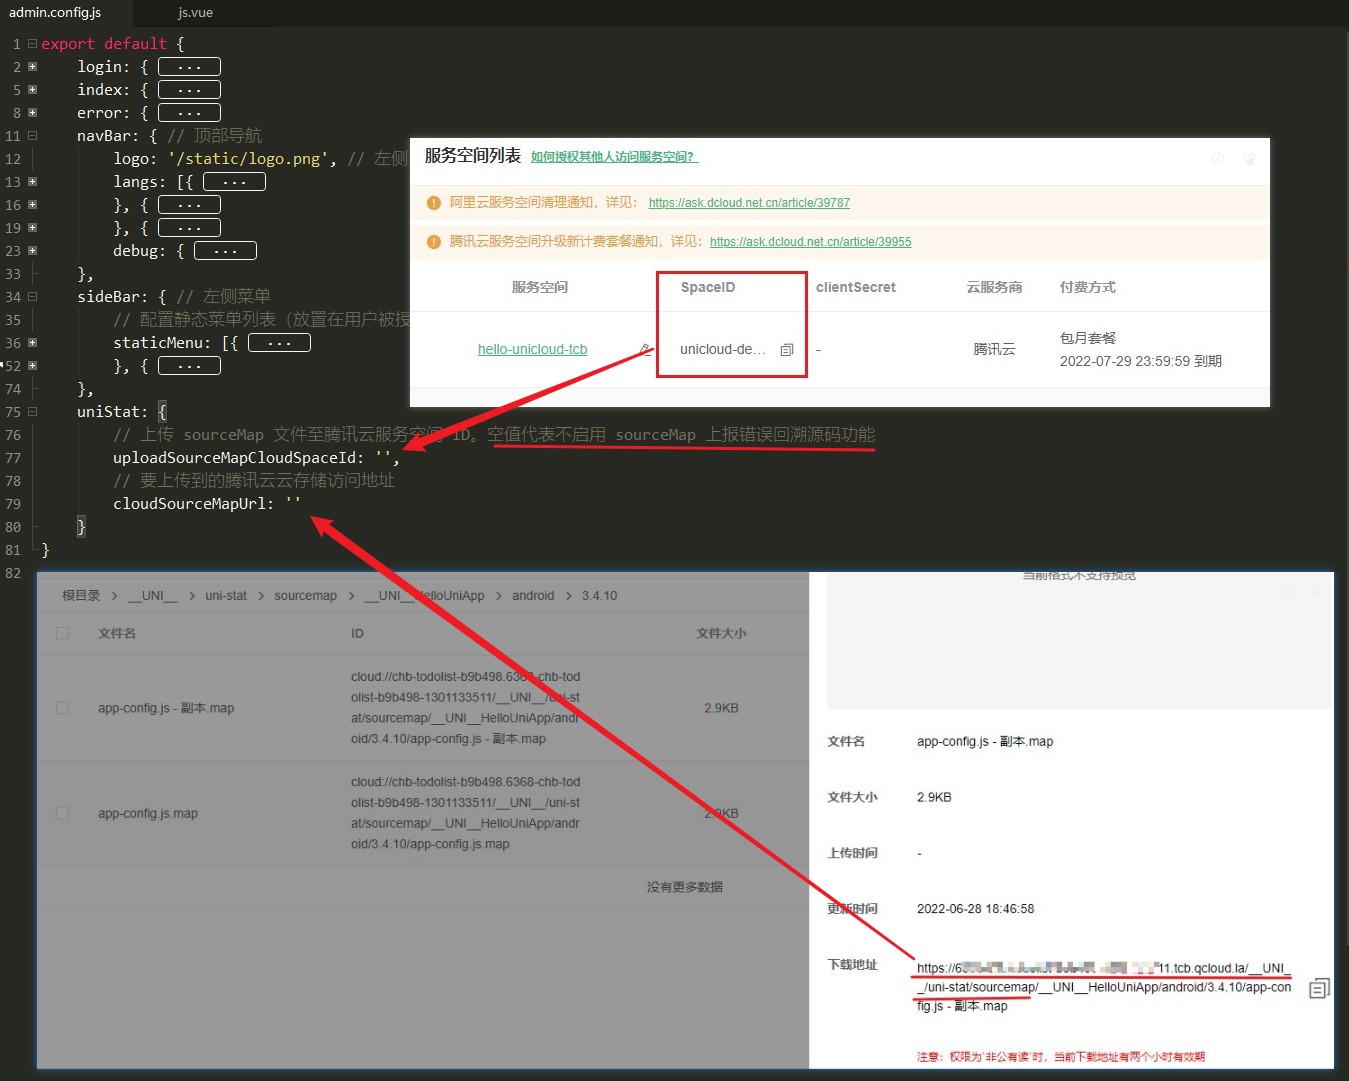
Run the uni-admin project into the browser, and on the uni statistics / error statistics / js error report page, there is an upload sourceMap button in the upper right corner of the error message list table. After clicking, it will display as follows:

Please fill in the complete information before uploading: Application, Platform, Version
Click the Choose file and upload button, after the Select Folder box pops up, please select the compiled sourceMap corresponding to the platform version. For example: Project root directory/unpackage/dist/build/.sourcemap/h5, select the h5 directory and click upload. If the upload fails in the middle, without refreshing the page, you can skip the uploaded file by re-selecting the folder to upload.
The contents of the folder will be uploaded to the cloud storage/__UNI__/uni-stat/sourcemap/application appId/platform (eg web, mp-weixin, ios)/version/ directory
Precautions
All users can readcross-domain configurationad or an advertisement field, please close the browser ad blocking extension and upload it againcloud storage/__UNI__/uni-stat/sourcemap/appId/platform (eg: web, mp-weixin, ios)) /version/) deleteOn the uni statistics / error statistics / js error report page, in the error information list table, click the details button on the right side of the table row to view the parsed error information in the pop-up window.
Example
Original error message:

Parsed error message:
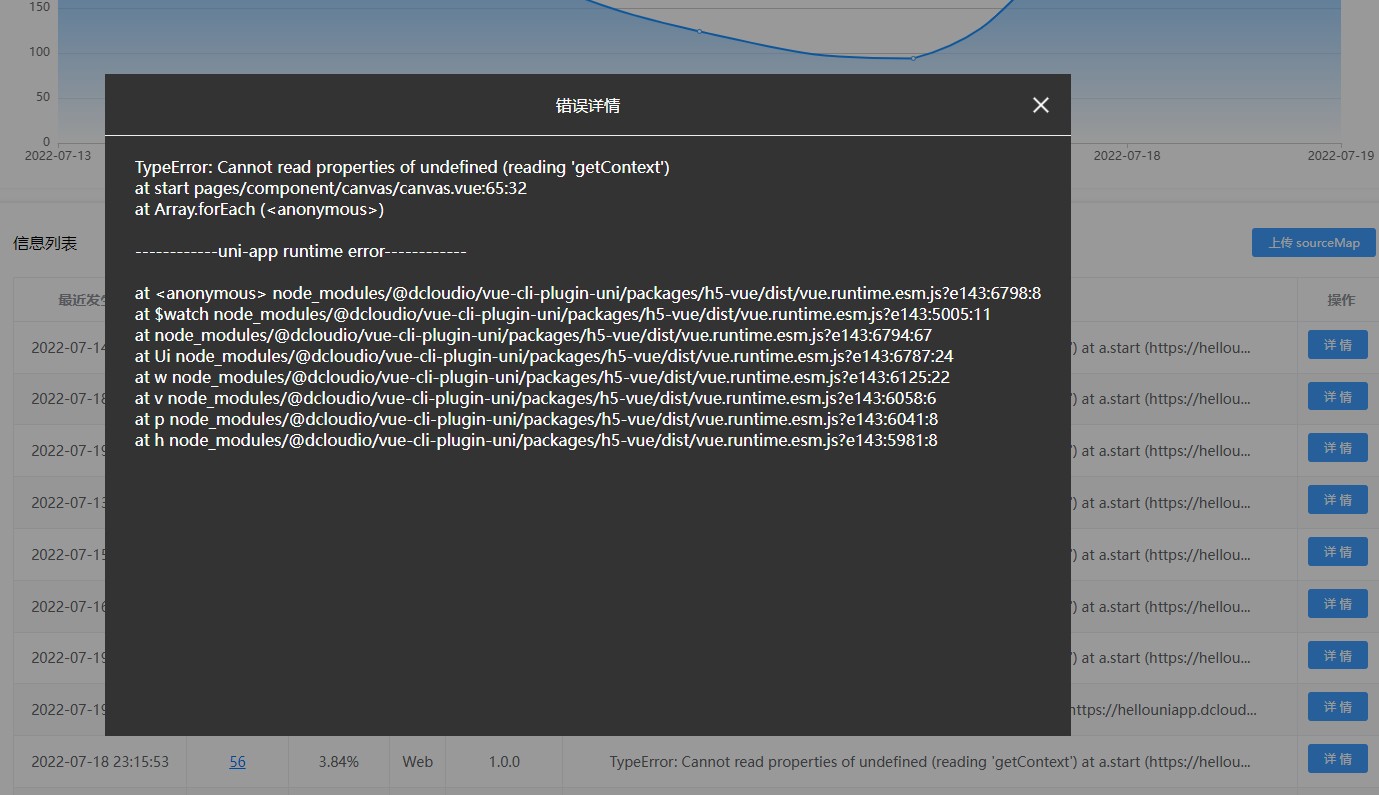
runtime error Below the separation line is the runtime error stack information of the platform framework, you don't need to care about itThe default data reporting interval is 10s. During the reporting interval, the data of each reporting node will be added to the statistics data queue. After 10s, the next reporting node will uniformly process the data queue and report it.
To save server-side resources, the data collected by the front-end is reported on a regular basis. So the escalation request does not happen in real time.
HBuilderX 3.5.4 or higher version can adjust the reporting period according to your own business needs, you can modify it in uni statistics configuration -> front-end data reporting period, in order to save server resources, it is recommended to fill in the range of 5- between 20.
When will the data be reported?
(HBuiderX -> Release -> Select the platform to open statistics)(manifest.json -> uniStatistics -> debug:true)In addition to the above two cases, data reporting will not occur in other cases, including App real machine runtime (including custom dock), crash and error data
App launch
The program starts at the beginning of the visit, and the end of the visit is as follows: entering the background for more than 5 minutes, no operation in the foreground for more than 30 minutes, and a new source program
| Reporting Fields | Description |
|---|---|
| lt | Statistical data type, the default value is 1, type see below |
| ut | Platform type, type see below |
| mpsdk | MiniApp SDK version |
| mpv | MiniApp platform version, such as WeChat, Alipay, etc. |
| mpn | Native platform package name, MiniApp appid |
| v | Application version. Native application |
| p | Mobile phone system, type see below |
| net | Network type, type see below |
| brand | Mobile phone brand |
| md | Mobile phone model |
| lang | language |
| lat | Latitude |
| lng | Longitude |
| pr | pixelRatio Device pixel ratio |
| ww | windowWidth can use window width |
| wh | windowHeight can use the window height |
| sw | screenWidth screen width |
| sh | screenHeight screen height |
| url | The full url of the current page, including parameters. Up to 255 characters |
| ch | Channel Information |
| fvts | First Visit Timestamp |
| lvts | Last Access Timestamp |
| en | Country |
| pn | province |
| ct | City |
| sc | Scene Value |
| tvc | The total number of visits by the user up to this visit |
| usv | stats sdk version |
| t | Timestamp when data was reported |
App goes to background
When the application enters the background, it is triggered by the application's onHide life cycle in the SDK
| Reporting Fields | Description |
|---|---|
| lt | Statistical data type, the default value is 3, type see below |
| ut | Platform type, type see below |
| p | Mobile system, type see below |
| urlref | Page where the app exits |
| urlref_ts | The duration of the last page when the app exits |
| ch | Channel Information |
| usv | stats sdk version |
| t | Timestamp when data was reported |
Page switch
Report when the page jumps. In the SDK, it is triggered by the onHide life cycle of the page.
| Reporting Fields | Description |
|---|---|
| lt | Statistical data type, the default value is 11, type see below |
| ut | Platform type, type see below |
| p | Mobile phone system, type see below |
| url | The full url of the current page, including parameters. Up to 255 characters |
| ttpj | title of the page defined in pages.json |
| ttn | title set via API uni.setnavigationbartitle |
| ttc | The title of the page reported via uni.report |
| ttct | title set in the title component |
| urlref | Page where the app exits |
| urlref_ts | The duration of the last page when the app exits |
| ch | Channel Information |
| usv | stats sdk version |
| t | Timestamp when data was reported |
Event trigger
When the user triggers some business logic
| Reporting Fields | Description |
|---|---|
| lt | Statistical data type, the default value is 21, type see below |
| ut | Platform type, type see below |
| p | Mobile phone system, type see below |
| url | The full url of the current page, including parameters. Up to 255 characters |
| e_n | Event Name |
| e_v | Event Parameters |
| ch | Channel Information |
| usv | stats sdk version |
| t | Timestamp when data was reported |
Application error
Report an error in the application
| Reporting Fields | Description |
|---|---|
| lt | Statistical data type, the default value is 21, type see below |
| ut | Platform type, type see below |
| p | Mobile phone system, type see below |
| ch | Channel Information |
| mpsdk | MiniApp SDK Version |
| mpv | MiniApp platform version, such as WeChat, Alipay, etc. |
| v | Application version. Native application |
| em | Error message |
| usv | stats sdk version |
| t | Timestamp when data was reported |
lt: Statistics type
| value | description |
|---|---|
| 1 | The application starts, corresponding to the onLaunch event |
| 3 | The application enters the background, corresponding to the application onHide event |
| 11 | Page jump, corresponding to page onHide event |
| 21 | Event Trigger |
| 31 | Application Error |
ut: platform type
| value | description |
|---|---|
| h5 | h5 |
| wx | |
| ali | Ali |
| bd | Baidu |
| qn | QuickApp |
| ks | Kuaishou |
| lark | Feishu |
| qw | QuickApp |
| dt | DingTalk |
p: phone system
| value | description |
|---|---|
| a | Android |
| i | iOS |
net: network type
| value | description |
|---|---|
| wifi | wifi network |
| 2g | 2g network |
| 3g | 3g network |
| 4g | 4g network |
| 5g | 5g network |
| none | No Internet |
| cable | cable |
In order to highlight the goal, only the folders and files related to uni statistics are commented out, and the rest are the same as ordinary uni-app projects. For new pages, please refer to similar pages in uni-stat.
├── cloudfunctions
├── common                             # 样式
│   │── uni.css                        # 公共样式
│   └── uni-icons.css                  # icon样式
├── js_sdk                             # js sdk
│       └── util.js
├── pages                              # 页面
│   └── uni-stat                       # uni统计页面
│       │── channel                    # 渠道(app)
│       │   │── channel.vue            # 页面(下同)
│       │   └── fieldsMap.js           # 字段配置(下同)
│       │── device                     # 设备统计
│       │   │── activity               # 渠道/场景分析
│       │   │   │── activity.vue
│       │   │   └── fieldsMap.js
│       │   │── comparison             # 平台对比
│       │   │   │── comparison.vue
│       │   │   └── fieldsMap.js
│       │   │── overview               # 今日概览
│       │   │   │── overview.vue
│       │   │   └── fieldsMap.js
│       │   │── retention              # 留存
│       │   │   │── retention.vue
│       │   │   └── fieldsMap.js
│       │   │── stickiness             # 粘性
│       │   │   │── stickiness.vue
│       │   │   └── fieldsMap.js
│       │   └── trend                  # 趋势分析
│       │       │── trend.vue
│       │       └── fieldsMap.js
│       │── error                      # 错误分析
│       │   │── error.vue
│       │   └── fieldsMap.js
│       │── event                       # 事件分析
│       │   │── event.vue
│       │   └── fieldsMap.js
│       │── index                       # 统计首页
│       │   │── index.vue
│       │   └── fieldsMap.js
│       │── page-ent                    # 入口页
│       │   │── page-ent.vue
│       │   └── fieldsMap.js
│       │── page-res                    # 受访页
│       │   │── page-res.vue
│       │   └── fieldsMap.js
│       │── page-content                # 内容统计
│       │   │── page-content.vue
│       │   └── fieldsMap.js
│       │── page-rule                   # 页面规则
│       │   │── page-rule.vue
│       │── pay-order                   # 支付统计
│           │── funnel                  # 支付/漏斗分析
│           │   │── funnel.vue
│           │   └── fieldsMap.js
│           │── list                    # 支付/订单明细
│           │   │── list.vue
│           │── overview                # 支付/订单概况
│           │   │── overview.vue
│           │   └── fieldsMap.js
│               └── ranking.vue
│       │── scene                       # 场景值(小程序)
│       │   │── scene.vue
│       │   └── fieldsMap.js
│       └── user                        # 用户统计
│           │── activity                # 渠道/场景分析
│           │   │── activity.vue
│           │   └── fieldsMap.js
│           │── comparison              # 平台对比
│           │   │── comparison.vue
│           │   └── fieldsMap.js
│           │── overview                # 今日概览
│           │   │── overview.vue
│           │   └── fieldsMap.js
│           │── retention               # 留存
│           │   │── retention.vue
│           │   └── fieldsMap.js
│           │── stickiness              # 粘性
│           │   │── stickiness.vue
│           │   └── fieldsMap.js
│           └── trend                   # 趋势分析
│               │── trend.vue
│               └── fieldsMap.js
├── static
├── store
├── admin.config.js
├── App.vue
├── main.js
├── mainfest.json
├── pages.json
├── postcss.config.js
└── uni.scss
1. Composition of uni statistics server
uni-config-center/uni-stat configuration module: Provides the necessary configuration parameters for uni stats to run.uni-stat public module: data processing module, including the processing and storage of the collected and reported data and the data processing of timed tasks.uni-stat-receiver report data receiver: Receive the data reported by the client and forward it to the public module for processing. Note: This cloud object depends on the uni-id public module.uni-stat-cron timed task cloud function: triggers timed tasks and forwards them to public modules for processing.2. Description of public modules
attention
Note: The uni statistics common module depends on the uniCloud configuration center (uni-config-center)
├── shared                              # 公共模块,提供公共函数库等支持。
│   │── create-api.js                   # 用来创建对外访问的实例
│   │── error.js                   		# 错误处理模块
│   │── index.js                   		# 入口文件,提供对外访问的基础模块
│   └── utils.js                     	# 工具函数库文件
├── stat                                # uni统计实际业务处理模块
│   │── lib                             # 工具类类库,提供日期计算、数据加密等额外功能支持。
│   │   │── date.js                     # 日期计算类文件
│   │   │── index.js                    # 入口文件,提供对外访问模块
│   │   └── uni-crypto.js               # 数据加密类文件,提供AES/MD5加密
│   │── mod                             # 数据模型,提供具体业务实现。
│   │   │── uni-pay                     # 支付统计目录
│   │   │   └── payResult.js            # 支付统计模型,跑批支付统计数据。
│   │   │── activeDevices.js            # 活跃设备模型,给周月维度的设备基础统计和留存统计提供数据,每日跑批合并,仅添加本周/本月首次访问的设备。
│   │   │── activeUsers.js              # 活跃用户模型,给周月维度的用户基础统计和留存统计提供数据,每日跑批合并,仅添加本周/本月首次访问的用户。
│   │   │── appCrashLogs.js             # 原生应用崩溃日志模型,记录原生应用的崩溃日志
│   │   │── base.js                     # 基类模型,提供基础服务支持
│   │   │── channel.js                  # 渠道模型,提供渠道和场景值数据
│   │   │── errorLog.js                 # 错误日志模型,记录上报的应用运行错误日志
│   │   │── errorResult.js              # 错误结果统计模型,统计汇总错误日志中的数据
│   │   │── event.js                    # 事件统计模型,提供应用的事件字典
│   │   │── eventLog.js                 # 事件日志模型,记录上报的事件日志
│   │   │── eventResult.js              # 事件结果统计,统计汇总事件日志中的数据
│   │   │── index.js                    # 入口文件,提供对外访问模块
│   │   │── loyalty.js                  # 设备/用户忠诚度(粘性)统计模型,统计设备/用户的粘性,粘性判断依据为:访问时长和访问页面数量
│   │   │── page.js                     # 页面模型,提供应用的页面字典
│   │   │── pageDetail.js               # 页面内容模型,提供页面规则匹配到的页面详情字典
│   │   │── pageDetailResult.js         # 页面内容统计模型,汇总统计页面内容的访问设备、时长、分享等数据
│   │   │── pageLog.js                  # 页面日志模型,记录上报的页面访问日志
│   │   │── pageResult.js               # 页面结果统计模型,统计汇总页面访问日志中的数据
│   │   │── platform.js                 # 应用平台模型,提供应用的平台字典
│   │   │── runErrors.js                # 运行错误日志,记录数据统计时运行出错的日志
│   │   │── scenes.js                   # 场景值模型,提供应用渠道和小程序场景值的数据字典
│   │   │── sessionLog.js               # 基础会话日志模型,记录设备访问时产生的会话日志
│   │   │── shareLog.js                 # 分享日志模型,记录触发分享事件的日志
│   │   │── statResult.js               # 基础数据结果统计模型,统计汇总会话数据包括不限于设备/用户的数量、访问量、活跃度(日活、周活、月活)、留存率(日留存、周留存、月留存)、跳出率、访问时长等数据
│   │   │── uniIDUsers.js               # uni-id 用户模型,提供uni-id用户数据查询
│   │   │── userSessionLog.js           # 用户会话日志模型,记录登录用户的会话日志
│   │   └── version.js                  # 应用版本模型,提供应用的版本号字典
│   │── receiver.js                     # 上报数据接收器,数据上报功能的分发入口文件
│   └── stat.js                         # 数据统计调度处理模块,数据统计及日志清理功能的分发入口文件
└── index.js                            # 代理入口文件,提供对外访问的uni-stat对象
The uni statistics configuration items are stored in the uni-stat/config.json file under the uniCloud configuration center (uni-config-center). Users can customize the value of each configuration item according to their own system needs.
attention
Note: After modifying the uni statistics configuration items, you need to re-upload the public module uni-config-center to take effect.
Basic parameters
| 配置项 | 默认值 | 说明 |
|---|---|---|
| debug | false | 开启调试模式 true: 开启,false:关闭,开启后会产生大量日志,生产环境请关闭。 |
| redis | false | 开启redis缓存,开启后可以降低数据库查询压力,提升uni统计性能,可按需决定是否开启。开启方法 |
| cachetime | 604800 | redis缓存有效期,单位秒。 |
| sessionExpireTime | 1800 | 会话过期时间,该配置用来判断当前会话是否已过期,一般情况下无需修改此项。 |
| realtimeStat | true | 开启实时统计,true: 开启,false:关闭,开启后会每小时统计一次,数据库读写次数会增多,可按需决定是否开启。 |
| cronMin | false | 开启分钟级定时任务,true: 开启,false:关闭。开启后定时任务将细分到分钟级执行,分摊数据计算压力,适合应用日活较大或有特殊需求的用户群体。具体的开启方法见设置定时任务云函数的触发周期。 |
| cron | - | 用于配置定时任务触发时间,详情见下方定时任务配置说明。 |
| pageDetailStat | false | 开启页面内容统计 true: 开启,false:关闭,开启后会产生大量日志,请按需开启。uni-admin 2.4.0起支持配置此项。 |
| batchInsertNum | 5000 | 当有批量写入操作时,限制单次写入数据库的最大条数。为防止写入超时,最大值为5000条。 |
| errorCheck | - | 错误检测,此项用于在规定时间内限制相同的错误日志写入数据库,防止有高频错误产生时造成大量的数据库写入操作。详情 |
| cleanLog | - | 日志清理,此项用于配置定时清理过期的日志,减少数据库数据的存储量,提升uni统计性能。详情 |
The cron parameter is used to configure the trigger time of the scheduled task. Generally, you do not need to modify this item.
| Parameters | Description |
|---|---|
| type | Scheduled task type: such as stat: basic data statistics |
| time | Trigger time expression: * * * * There are four digits in total, representing from left to right: week (1-7 represents Monday to Sunday)/day/hour/minute. Example: Triggered at 0:00 every night, it should be written as * * 0 0 |
The current types of scheduled tasks are (The content in brackets below indicates the trigger time of the scheduled task after the minute-level statistics are enabled):
stat: basic data statistics, statistical dimensions include:
every hour (0 minutes), statistics of basic data for the last hourevery Monday at 1:00 am (20 minutes) by default, statistics the basic data of the previous weektriggered at 3:00 am (30 minutes) on the 1st of each month, statistics the basic data of the previous monthretention-device: Device retention data statistics, statistical dimensions include:
every day at 2:00 am (20 minutes), and the daily retained data of the device is counted (the initial statistics of the retention status from the day before yesterday to yesterday, so it takes at least three days to have data)every Monday at 2:00 am (30 minutes) by default, to count the weekly retained data of the device (the initial statistics of the retention from the last week to the last week, so it takes at least three weeks to have data)4:00 am (30 minutes) on the 1st of each month, to count the monthly retained data of the device (the initial statistics are about the retention of the previous month to the previous month, so it will take at least three months to have data)retention-user: User retention data statistics, statistical dimensions include:
every day at 3:00 a.m. (40 minutes) by default, to count the daily retained data of users (the initial statistics of retention from the day before yesterday to yesterday, so it takes at least three days to have data)every Monday at 5:00 am (30 minutes) by default, and statistics the user's weekly retention data (the initial statistics of the retention status from the last week to the last week, so there will be data after at least three weeks of operation)6:00 am (40 minutes) on the 1st of each month, to count the monthly retention data of users (the retention status from the previous month to the previous month is initially counted, so it takes at least three months to have data)active-device: Active device data archive, statistical dimensions include:
every day at 0:00 am (10 minutes) by default, and archives the active device data of the previous day. Note: this data should be kept in basic data statistics, device retention data statistics, user retention data Executed before the weekly statistics and monthly statistics in Statistics` are triggered.active-user: Active user data archive, statistical dimensions include:
every day at 0:00 am (20 minutes) by default, and archives the active user data of the previous day. Note: this data must be kept in basic data statistics, device retention data statistics, user retention data Executed before the weekly statistics and monthly statistics in Statistics` are triggered.page: page data statistics, statistical dimensions include:
page-detail:页面内容统计,统计维度包括:
每天上午7点(10分钟)触发,统计前一天的页面内容数据event: Event data statistics, statistical dimensions include:
error: Error data statistics, statistical dimensions include:
triggered at 5:00 a.m. (20 minutes) every day, statistics the error data of the previous dayclean:过期日志清理定时任务:
every day at 5:00 am (30 minutes), to clean up expired log datapay-result: Payment data result statistics, statistical dimensions include:
hourly (10 minutes) by default, statistics of the basic data of the last hour (during real-time statistics, the data of hour, day, week, month, quarter, and year will be automatically counted, no need to configure other dimensions statistics)The errorCheck parameter is used to limit the same error log to be written to the database within a specified time to prevent a large number of database write operations caused by high-frequency errors. It can be turned on or off as needed.
| Parameters | Description |
|---|---|
| needCheck | Need to check: true: yes; false: no |
| checkTime | Error check interval time, in minutes. |
The cleanLog parameter is used to configure regular cleaning of expired logs, reduce the storage capacity of database data, and improve uni statistics performance.
| Parameters | Description |
|---|---|
| open | Whether to enable log cleaning: true: yes; false: no |
| reserveDays | Retention days configuration for each log, parameter format: log type: retention days, for example: sessionLog: 31 means to reserve session logs for 31 days, and if the retention days is set to 0, it means permanent retention (this will Accumulate a lot of useless data, not recommended) |
The currently configurable log types are:
Basic session log: sessionLog, keep logs for 31 days by default. Note: Because the device retention statistics need to count the retained data after 30 days at the longest, the basic session logs must be stored for at least 31 days, otherwise the device retention statistics will be affected.User session log: userSessionLog, keep logs for 31 days by default. Note: Because the user retention statistics need to count the retained data after 30 days at the longest, the user session log must be kept for at least 31 days, otherwise it will affect the user retention statistics.Page log: pageLog, keep logs for 7 days by default.Event log: eventLog, keep logs for 7 days by default.Share log: shareLog, keep logs for 7 days by default.错误日志:errorLog,默认保留7天的日志。实时统计数据:resultHourLog,默认保留30天的日志。app崩溃日志:appCrashLog,默认保留7天的日志。Notes
uni statistics provides basic data reports. If the expected data collection cannot be achieved, you can freely report data through uni.report(eventKey,param) on the client side, and add pages through uni-admin to collect statistics by yourself.
The basic usage of uni.report(eventKey,param) is listed here, the complete API view: Details
uni.report(eventKey,param) takes two parameters.
// parameter supports string
uni.report('购买','购买成功')

// parameter support object
	id:'1000',
	price:'998',
	msg:'购买成功'
	// ...
})
Add new page in uni-admin, use uniCloud API to get all uni-report The reported raw data is stored in the uni-stat-event-logs table.
const db = uniCloud.database()
db.collection('uni-stat-event-logs')
不管是新上报的数据,还是opendb的数据、或者开发者自己的业务数据库里的数据,都可以自己编写报表进行统计分析。
Like ordinary uni-app pages, create a new page and write code.
When registering the left menu in uni-admin, you need to refer to the document: [uni-admin left window - menu bar](https://uniapp.dcloud.io/uniCloud/admin.html#%E5%B7% A6%E4%BE%A7%E7%AA%97%E5%8F%A3-%E8%8F%9C%E5%8D%95%E6%A0%8F)
uni-admin1.9.0 version starts (corresponding to HBuilderX 3.5.1), uni statistics and uni uni-upgrade-center center reuse the same application version table (ie opendb-app-versions table), discard the original The uni-stat-app-versions table.
If you have enabled uni-statistics 2.0 but are using an older version of uni-admin, you need to pay attention to the migration and upgrade of the version table, otherwise the version-based statistics may be inaccurate.
Upgrade steps:
uni-admin project from the plugin marketuni-stat public moduleDB Schemauni-stat-app-versions table into the opendb-app-versions table; a code snippet is provided below, you can create a cloud function and copy the sample code to the cloud function , right-click to execute "Run - Local Cloud Function" to automatically complete the migration of data content;'use strict';
const db = uniCloud.database()
exports.main = async (event, context) => {
const oldVersionDataRes = await db.collection('uni-stat-app-versions')
.aggregate()
.lookup({
from: 'uni-stat-app-platforms',
localField: 'platform_id',
foreignField: '_id',
as: 'platform'
})
.limit(500)
.end()
if (oldVersionDataRes.data.length) {
for (let oldKey in oldVersionDataRes.data) {
// data of the old version table
const oldVersionData = oldVersionDataRes.data[oldKey]
//Assemble data
const newVersionData = {
appid: oldVersionData.appid,//appid
platform: [],//默认为空数组即可
uni_platform: oldVersionData.platform[0].code,//平台代码
version: oldVersionData.version,
create_env: 'uni-stat',//创建来源,设置为uni-stat
}
await db.collection('opendb-app-versions').add(newVersionData)
}
}
return true
};
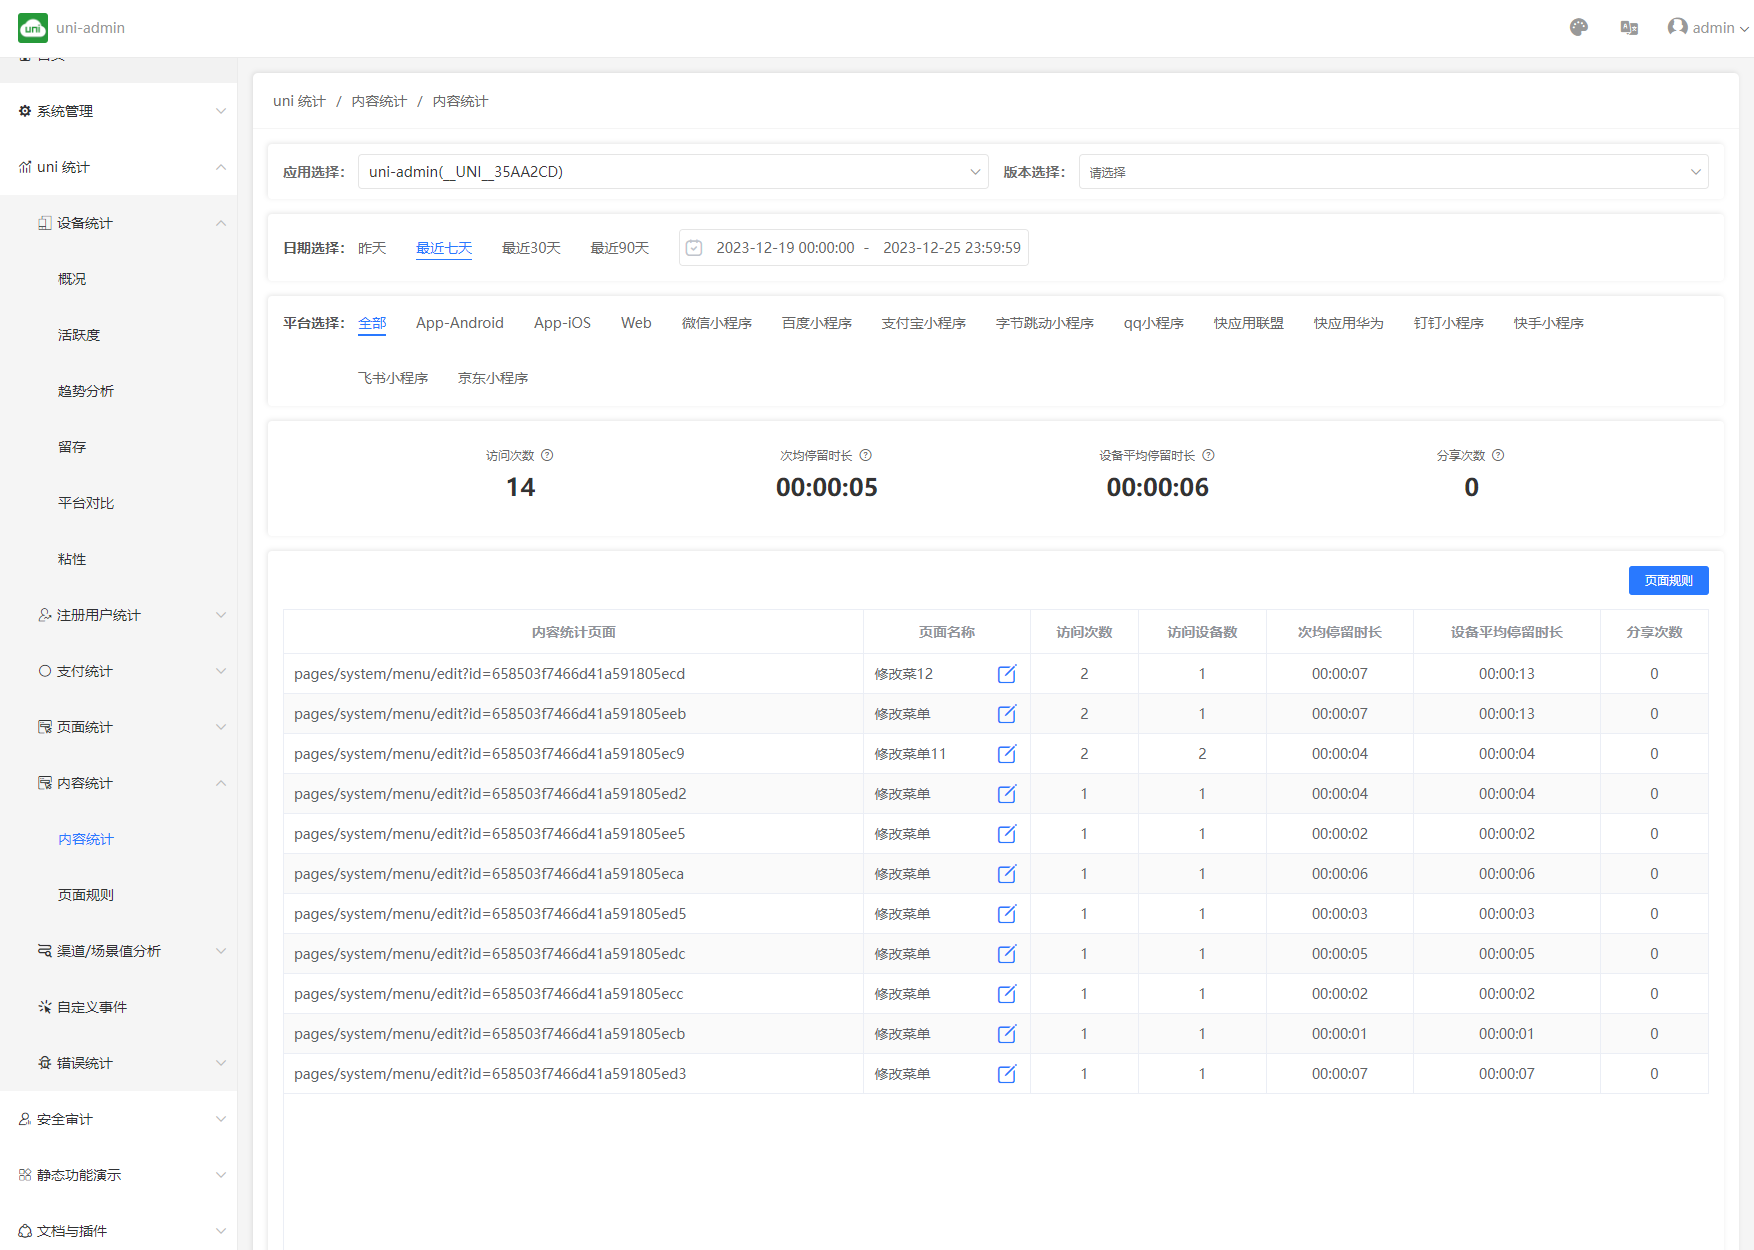
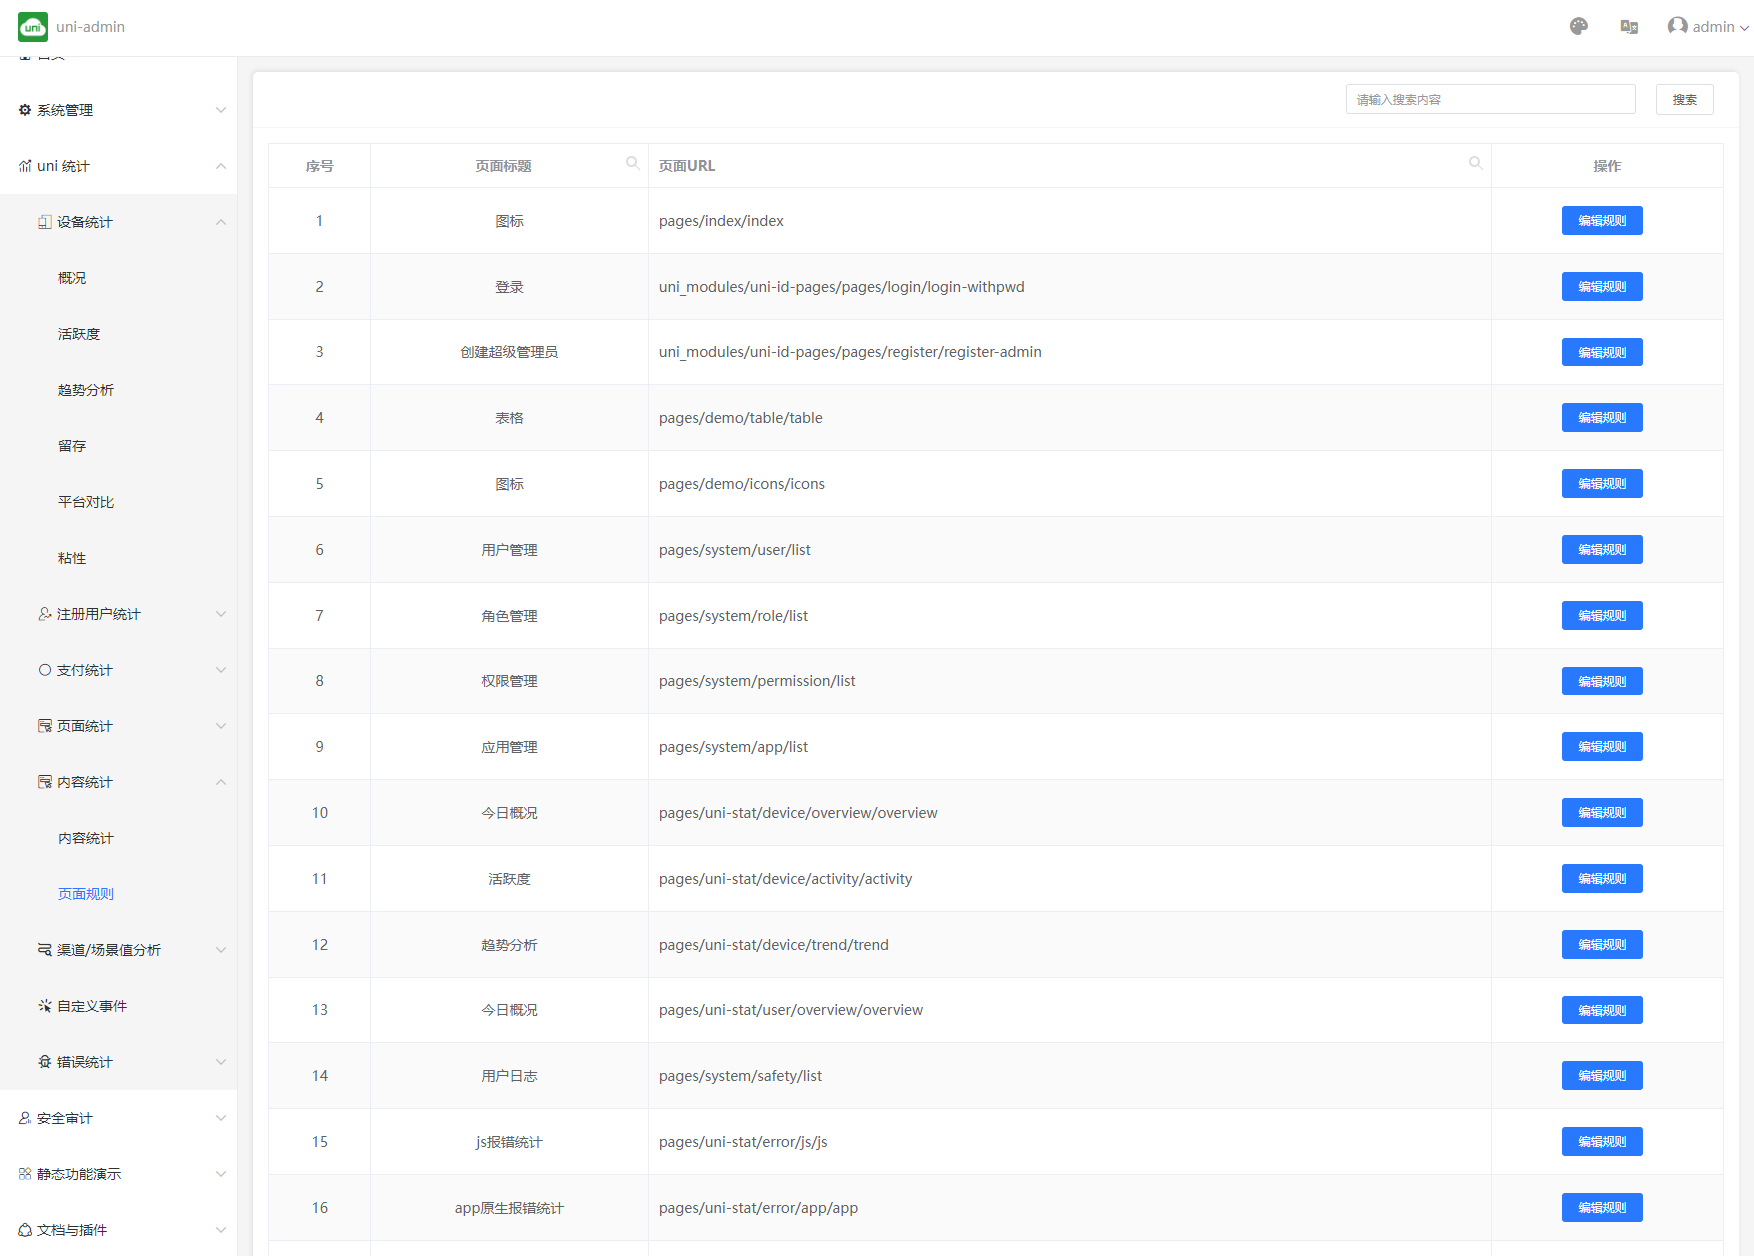
uni-admin2.4.0 版本开始,新增了内容统计,可以通过设置页面规则进行内容统计。内容统计模块默认处于关闭状态,开启内容统计后会增加大量的数据库读写次数,请按需开启。开启内容统计的方式,可参考公共模块配置项说明。
演示图
内容统计
页面规则
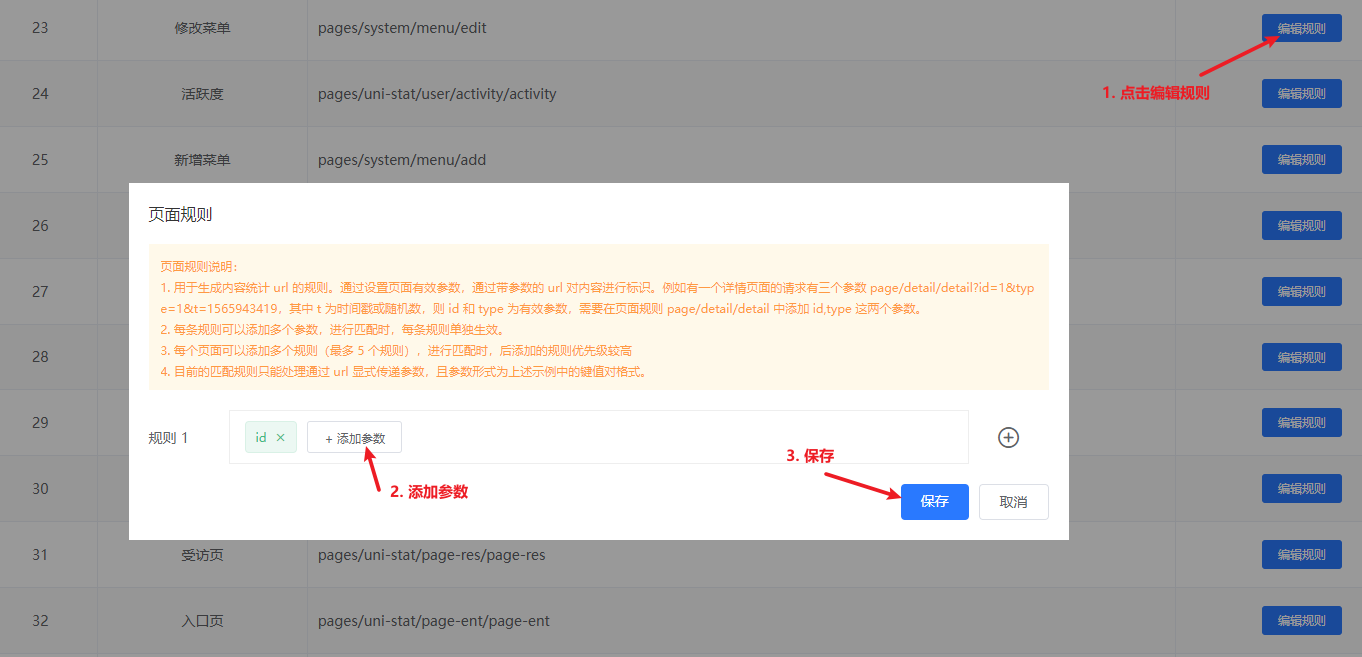
设置页面规则
注意
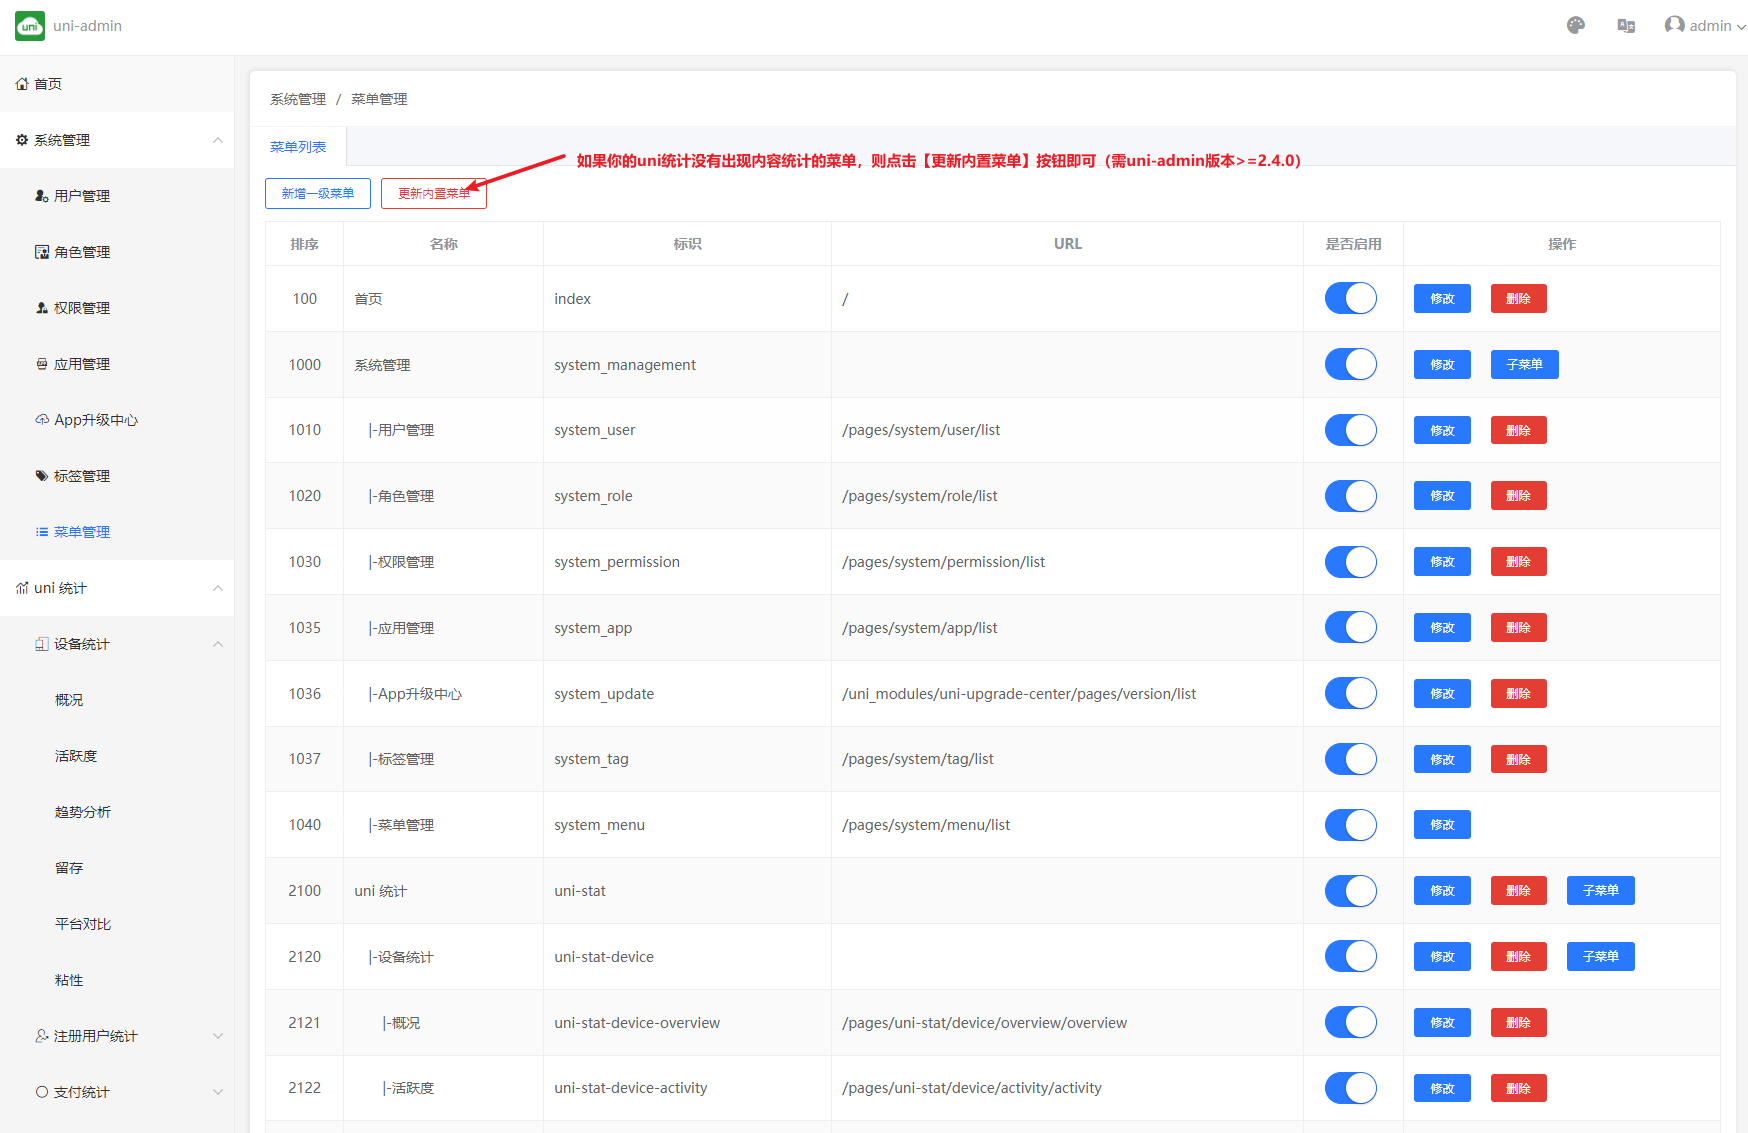
如果升级uni-admin后,你的uni统计没有出现内容统计的菜单,则点击菜单管理里的【更新内置菜单】按钮即可(需uni-admin版本>=2.4.0)
uni-admin2.4.24 版本开始,新增了对App-Harmony(即鸿蒙App)平台的统计。
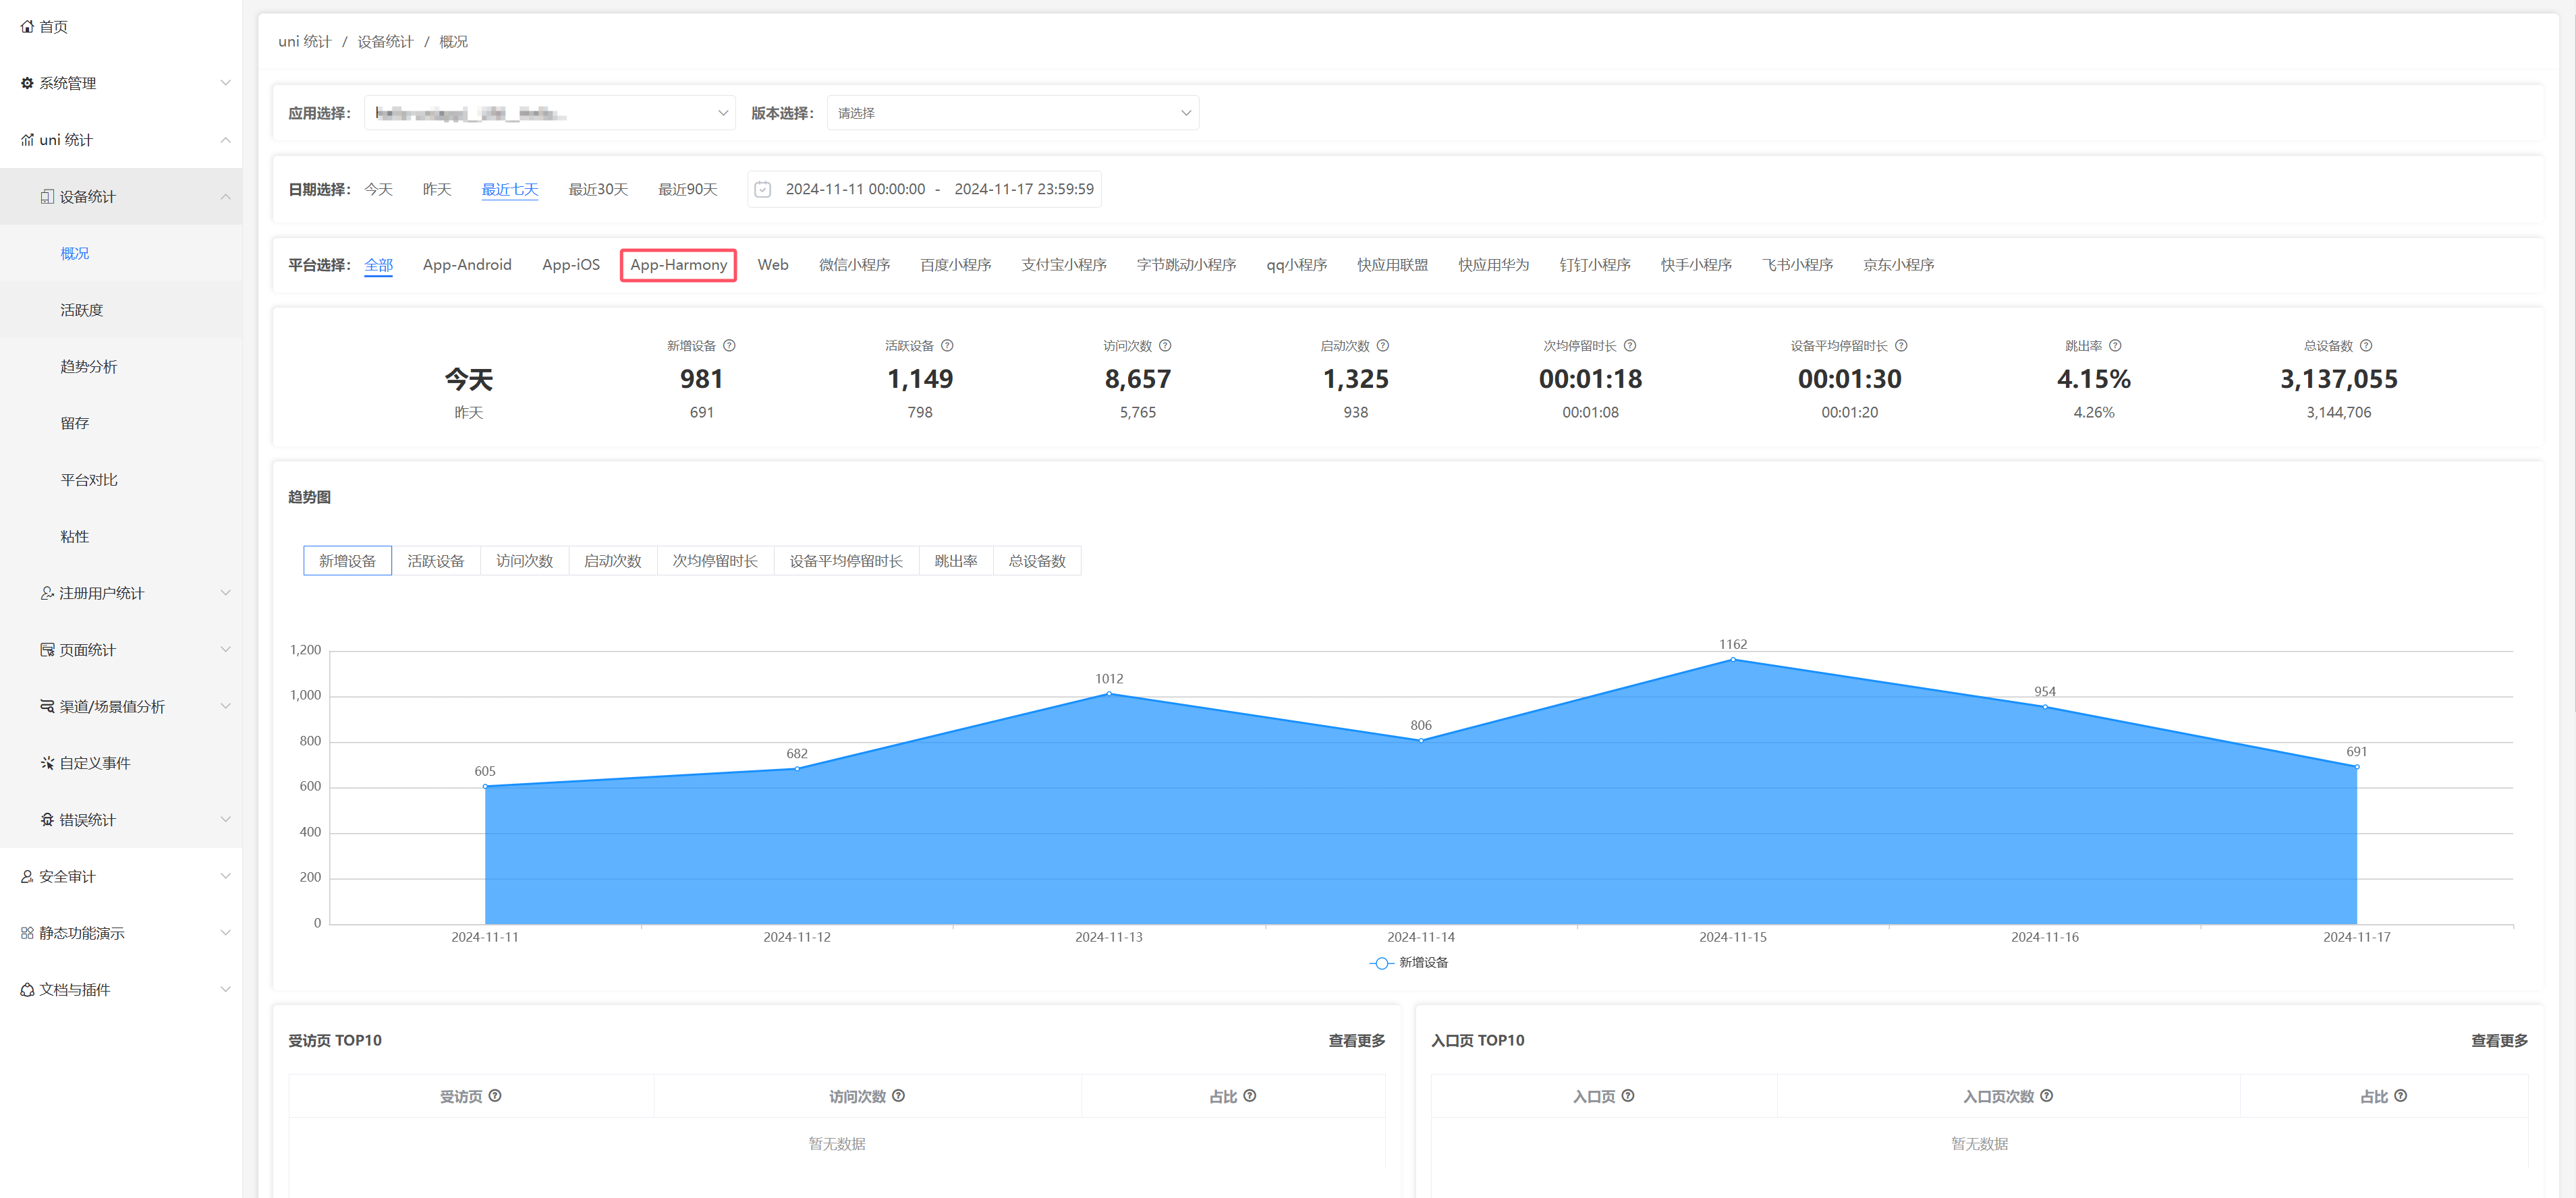
若您部署过uni-admin2.4.24之前的版本,需要先将uni-admin升级到2.4.24之后的版本。
升级uni-admin项目的方法
HBuilderX部署uni-admin项目的用户,可直接在HBuilerX 中,找到uni-admin项目根目录/package.json文件,右键 => 从插件市场更新,合并项目文件后重新打包、发布uni-admin项目即可。注意

在线部署功能,部署uni-admin项目的用户,可重新在插件市场选择在线部署,注意appid需要与原uni-admin项目的AppId保持一致,否则将会导致管理员账号无法登录,原uni-admin项目的AppId,可在插件市场的插件部署记录模块查看。
在uni-admin项目中添加App-Harmony服务平台
如果您在uni-admin项目中,无法找到App-Harmony平台,您需要在HBuilderX中,找到uni-admin项目根目录/uniCloud/database/JQL查询.jql文件,添加以下jql语句并运行。
注意
在线部署功能,部署uni-admin项目的用户,需要先在HBuilderX中创建uni-admin项目,并关联原部署uni-admin项目服务空间,再进行如上操作。db.collection('uni-stat-app-platforms').add({
"name": "App-Harmony",
"code": "harmony",
"order": 2,
"enable": true,
"create_time": 1730886932506
})
升级HBuilderX至4.33+,重新打包、发布您要统计的应用
uni-admin项目更新后,即可正常接收和统计App-Harmony平台的相关数据。此外,您还需要升级uni统计2.0的前端采集SDK,采集数据才能正常上报,即需要将HBuilderX版本升级至4.33+后,重新打包发布您要统计的应用。
uni-admin2.4.25 版本开始,新增了对鸿蒙元服务平台的统计。
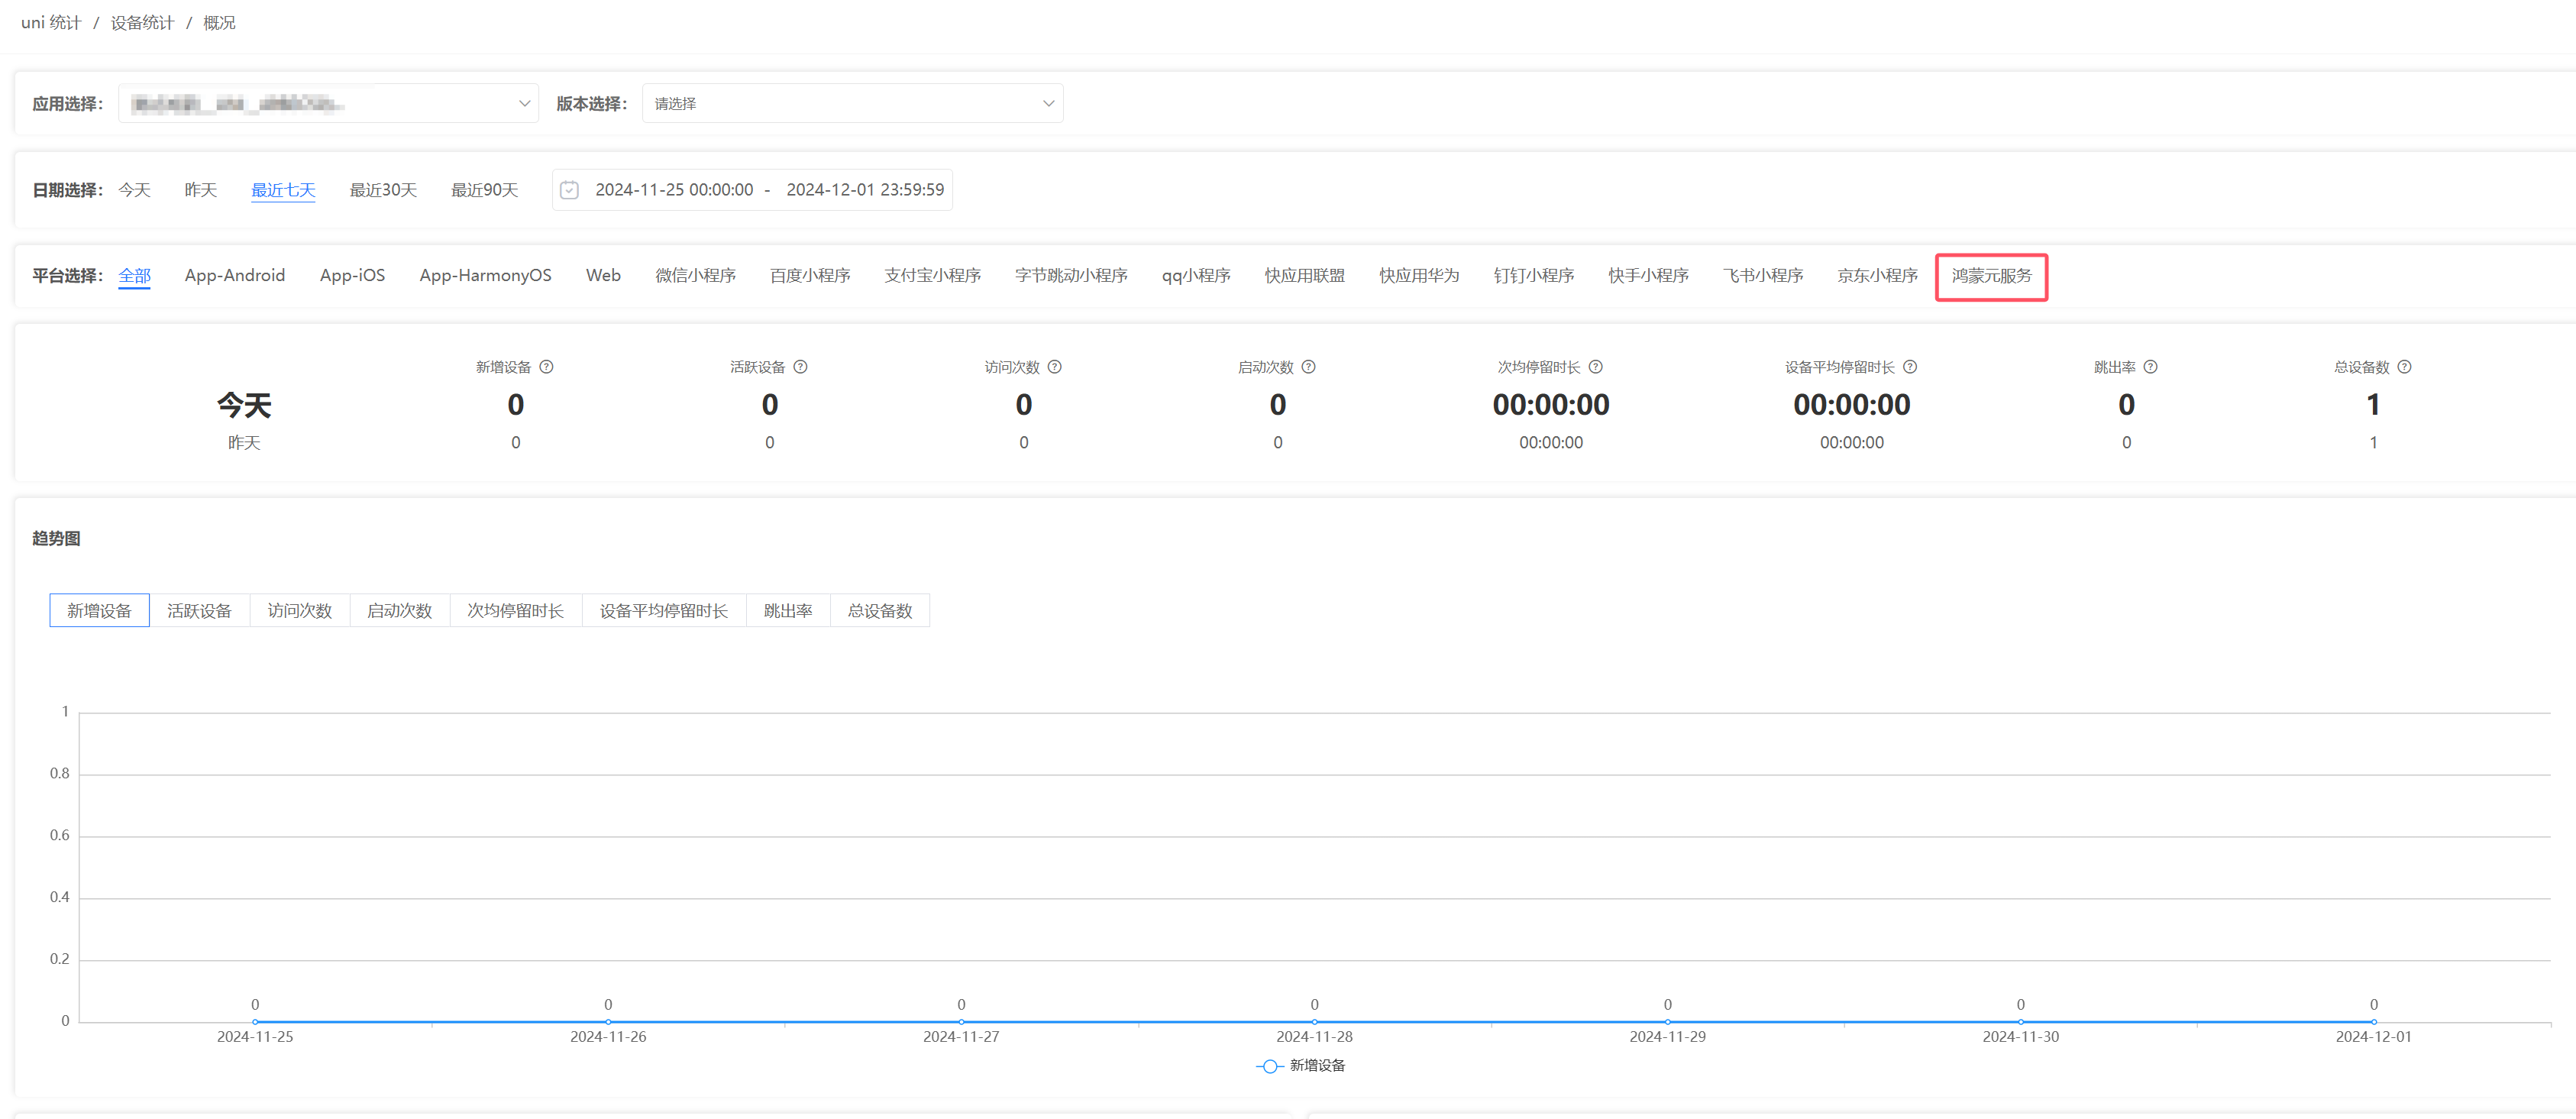
若您部署过uni-admin2.4.25之前的版本,需要先将uni-admin升级到2.4.25之后的版本,升级uni-admin项目的方法,可参考上方升级到2.4.24+ 含鸿蒙平台的版本中的说明。
在uni-admin项目中添加鸿蒙元服务平台
如果您在uni-admin项目中,无法找到鸿蒙元服务平台,您需要在HBuilderX中,找到uni-admin项目根目录/uniCloud/database/JQL查询.jql文件,添加以下jql语句并运行。
注意
在线部署功能,部署uni-admin项目的用户,需要先在HBuilderX中创建uni-admin项目,并关联原部署uni-admin项目服务空间,再进行如上操作。db.collection('uni-stat-app-platforms').add({
"code":"mp-harmony",
"order":16,
"enable":true,
"create_time":163998979103
})
升级HBuilderX至4.33+,重新打包、发布您要统计的应用
uni-admin项目更新后,即可正常接收和统计鸿蒙元服务平台的相关数据。此外,您还需要升级uni统计2.0的前端采集SDK,采集数据才能正常上报,即需要将HBuilderX版本升级至4.33+后,重新打包发布您要统计的应用。
Recently, the uniCloud Alibaba Cloud version has been officially commercialized. Some developers have begun to struggle with cloud-integrated services such as `uni statistics' based on uniCloud. They don't know how much these services are expected to cost. The program is more cost-effective.
本文尝试算细账、算总账,以阿里云按量计费为例,详细预测uni统计在不同用户规模下的资源消耗及对应费用,帮助大家明智选择,无忧开发。
This article is mainly divided into three parts:
uni statisticsuni statisticsUni Statistics Consumed Resource Cost Calculation
The parts of uni statistics involving expenses are mainly divided into:
uni statistics cloud function, there are 2 cloud functions
uni-stat-uni-admin, the administrator releases a new versionNext, we conduct cost assessments for different resources.
After enabling uni statistics, each of your online users will request the uni-stat-receiver cloud function every 10 seconds by default (if your DAU is more than 10,000, you can change it to 60 seconds, which can reduce the cost. Time The interval can be set in manifest.json, if the user stays on one page, it will not be reported repeatedly)
我们按照uniCloud官网列出的按量计费规则,计算一下云函数的资源消耗。
| Resource classification | Resource details | Price (yuan) |
|---|---|---|
| Cloud Function | Resource Usage (GBs) | 0.000110592 |
| Number of calls (10,000 times) | 0.0133 | |
| Outbound traffic (GB) | 0.8 | |
| Cloud Database | Capacity (GB/day) | 0.07 |
| Number of read operations (10,000 times) | 0.015 | |
| Number of write operations (10,000 times) | 0.05 | |
| Cloud storage | Capacity (GB/day) | 0.0043 |
| Number of download operations (10,000 times) | 0.01 | |
| Number of upload operations (10,000 times) | 0.01 | |
| CDN Traffic (GB) | 0.18 | |
| Front-end website hosting | Capacity (GB/day) | 0.0043 |
| Traffic (GB) | 0.18 |
We can simply derive the following formula:
Cloud function/cloud object cost = resource usage * 0.000110592 + number of calls * 0.0133 / 10000 + outbound traffic * 0.8
in:
We assume the following data model:
According to the above formula, if there are 100 daily active users, the daily cost of the uni-stat-receiver cloud function of uni statistics is:
云函数费用(天) = 资源使用量 * 0.000110592  + 调用次数 * 0.0133 / 10000 + 出网流量 * 0.8
				= 0.125 * 0.1 * (100 * 10) * 0.000110592 + (100 * 10) * 0.0133/10000 + (100 * 10) * (0.7 / 1024 / 1024) * 0.8
				= 0.001382 + 0.00133 + 0.000534
				≈ 0.0032(元)
That is: your App DAU is 100, and after using the commercial version of uni statistic, the uni-stat-receiver cloud function consumes about 0.0032 yuan per day.
According to this, the monthly cost can be calculated as: 0.0032 * 30 ≈ 0.1, that is, when the daily activity is 100, the monthly uni-stat-receiver cloud function only needs 0.1 yuan.
In the same way, we can deduce that for apps with 1,000, 10,000, and 100,000 daily activities, the monthly cost of the uni-stat-receiver cloud function is as follows:
| 日活 | 资源使用量计费(元/日) | 调用次数计费(元/日) | 出网流量计费(元/日) | 日合计(元/日) | 月合计(元/月) |
|---|---|---|---|---|---|
| 100 | 0.001382 | 0.00133 | 0.000534 | 0.0032 | 0.10 |
| 1000 | 0.01382 | 0.0133 | 0.00534 | 0.0325 | 0.98 |
| 10000 | 0.1382 | 0.133 | 0.0534 | 0.3246 | 9.74 |
| 100000 | 1.382 | 1.33 | 0.534 | 3.2460 | 97.38 |
uni statistic also has a cloud function uni-stat-cron, which is a scheduled data running batch task, which is used to count the reported data and generate statistical reports.
We assume the following data model:
The daily cost of the uni-stat-cron cloud function of uni statistics is:
云函数费用(天) = 资源使用量 * 0.000110592  + 调用次数 * 0.0133 / 10000 + 出网流量 * 0.8
				= 0.5 * 1 * 24 * 0.000110592 + 24 * 0.0133/10000 + 0
				= 0.001327104 + 0.00003192 + 0
				≈ 0.0014(元)
That is: your App DAU is 100, and after using the commercial version of uni statistic, the uni-stat-receiver cloud function consumes about 0.0014 yuan per day.
According to this, its monthly cost can be calculated as: 0.0014 * 30 ≈ 0.04, that is, when the daily activity is 100, the monthly uni-stat-receiver cloud function only needs 0.04 yuan.
In the same way, we can deduce that for apps with 1,000, 10,000, and 100,000 daily activities, the monthly cost of the uni-stat-receiver cloud function is as follows:
| 日活 | 平均耗时(秒) | 资源使用量计费(元/日) | 调用次数计费(元/日) | 出网流量计费(元/日) | 日合计(元/日) | 月合计(元/月) |
|---|---|---|---|---|---|---|
| 100 | 1 | 0.001327 | 0.00003192 | 0 | 0.0014 | 0.04 |
| 1000 | 3 | 0.003981 | 0.00003192 | 0 | 0.0040 | 0.12 |
| 10000 | 30 | 0.039813 | 0.00003192 | 0 | 0.0398 | 1.19 |
| 100000 | 90 | 0.119439 | 0.00003192 | 0 | 0.1195 | 3.59 |
Since the uni-stat-cron cloud function only runs 24 times a day regardless of the daily activity, the daily activity has little impact on its cost (only the duration of each operation is affected).
按照uniCloud官网介绍,云数据库费用 = 容量费用 + 读操作次数费用 + 写操作次数费用,其中:
uni statistics will generate a large amount of log data, but by default there will be a strategy for automatically clearing historical logs, for example: session log data 31 days ago will be deleted.
Since uni statistics involves a very complicated database, we have obtained the following results through the actual operation data of the official statistics sample project:
For an application with a DAU of 100, the resource usage of uni statistics database is as follows:
The above figures are calculated from the Official Statistics Sample Project.
Therefore, the following data model can be obtained:
Because the data source is only kept for 31 days, the data volume will remain at 31 days after stable operation. Therefore, the cloud database capacity in the formula below needs to be multiplied by 31
				= 0.00052 * 31 * 0.07  + 2000 * 0.015/10000 + 2000 * 0.05/10000
				= 0.0011284 + 0.003 + 0.01
				≈ 0.0141(元)
That is: if your uni statistics business DAU is 100, after using the cloud service space of Alibaba Cloud Commercial Edition, the corresponding database will consume about 0.0141 yuan per day.
Based on this, the monthly cost can be calculated as: 0.0141 * 30 ≈ 0.42, that is, when the DAU is 100, the monthly cloud database only needs 0.42 yuan.
| Daily activity | Capacity fee (G) | Read operation fee (yuan/day) | Write operation fee (yuan/day) | Day total (yuan/day) | Month total (yuan/month) |
|---|---|---|---|---|---|
| 100 | 0.0011284 | 0.003 | 0.01 | 0.0141 | 0.42 |
| 1000 | 0.011284 | 0.03 | 0.10 | 0.1413 | 4.24 |
| 10000 | 0.11284 | 0.30 | 1.00 | 1.4128 | 42.38 |
| 100000 | 1.1284 | 3.00 | 10.00 | 14.1284 | 423.85 |
Redis only affects the read operation of the database. According to the comparison before and after using redis in the official statistical sample project, it can be seen that redis can reduce the number of database read operations by about 2/3 (equal to reducing the cost of database read times by 2/3).
| daily activity | cost of read operations (yuan/month) (redis not enabled) | cost of read operations (yuan/month) (redis enabled) | cost reduction per month after redis is enabled (yuan) |
|---|---|---|---|
| 100 | 0.09 | 0.03 | 0.06 |
| 1000 | 0.90 | 0.30 | 0.60 |
| 10000 | 9.00 | 3.00 | 6.00 |
| 100000 | 90.00 | 30.00 | 60.00 |
It can be seen that when the daily activity is lower than 100,000, the cost reduction of redis is not obvious. But when the daily activity is greater than 100,000, the role of redis becomes more and more obvious.
uni statistics needs to be used in conjunction with uni-admin, and uni-admin needs to be deployed in the front-end web hosting. uni-admin is mainly used by administrators, with less frequent use and lower traffic.
按照uniCloud官网介绍,前端网页托管费用 = 容量费 + 流量费。
uni-admin is compiled to 4.7M. According to the rule of 0.0043 yuan per GB per day on the official website, the monthly capacity fee of uni-admin is: 4.7 / 1024 * 0.0043 * 30 = 0.00059, which is less than 1 cent. Ignorable.
The administrator logs in to uni-admin and browses the statistical data on the uni statistics management page. The traffic required does not exceed 3M. Even if updates are released twice a month, the estimated traffic fee is: 3 / 1024 * 0.18 * 2 = 0.00105, which is less than 1 cent, can also be ignored.
The monthly fee is less than 1 cent, which can be ignored.
After comparing the detailed items, let's combine them to see how much they need to spend per month using uni statistics.
| Daily Active | Cloud Function (RMB/month) | Cloud Database (RMB/month) | Front-end Web Hosting (RMB/month) | Monthly Total (RMB/month) |
|---|---|---|---|---|
| 100 | 0.14 | 0.42 | 可忽略不计 | 0.56 |
| 1000 | 1.10 | 4.24 | 可忽略不计 | 5.34 |
| 10000 | 10.93 | 42.38 | 可忽略不计 | 53.31 |
| 100000 | 100.97 | 423.85 | Negligible | 524.82 |
Using uni statistics, free access, one-click installation, you will get:
1. Full port
Full terminal traffic statistics, one report can view the operation data of all terminals (iOS, Android, Web and various MiniApp).
There is no need to connect different SDKs at each end, and there is no need to view data in different reports. At present, the only solution known in the market is to view the business panorama in one report.
2. Open source, free, free customization
All codes are open source. What data to collect can be customized; batch running frequency can be customized (real-time statistics can be done during activities); display reports can be customized.
3. Private deployment, data self-control
Using traditional saas statistical products, all data are reported to statistical service vendors.
uni Statistics 2.0 is implemented based on uniCloud. Cloud functions and statistical data are all hosted in the developer's own service space (Alibaba Cloud or Tencent Cloud optional), and developers have complete control over their own statistical data.
4. Effective error analysis
Traditional app statistics platforms do not have js error statistics. Developers cannot know on which devices their js code will report errors.
The error information collected by uni is more comprehensive, including js front-end errors and app native layer crashes.
Because uni-app runs after compilation, the traditional web and MiniApp statistics platform, its js error cannot be traced back to the source code of uni-app before compilation, and the error report is incomprehensible.
uni statistics support sourcemap, which can intuitively understand which line of code is wrong. See details
real case scenario
[A real example of acquiring 4 million customers in one and a half months](https://mp.weixin.qq.com/s?__biz=MzU3NTU5NDc0NA==&mid=2247491214&idx=1&sn=7e334d079146d9e31cea407f45bd8624&chksm=fd219719ca561e0f9a85b30017618eaf9551b46cdd6ecdf856bc4e47aee4ca93767fcf23147f&mpshare=1&scene=1&srcid=0713VwAOIuRllzMB6syoQssb&key= 15a2b72b2464b4fe73325967f733ac332583d5db37f1812c63613c083a8f5921bca2ada2140d45e07657b062dc451f27cc48fe4fd298f6456f300895a90bd471480afdc2c8dc5a45254fb1dc48d3b79a&ascene=1&uin=MTkzNjMxMzU%3D&devicetype=Windows+10&version=62060833&lang=zh_CN&pass_ticket=xW6dPp%2F565g5S8hl1lz%2F8FLQBEzW6KUHyyqyHPdT2nk%3D)
Let’s go back to uni statistics again. From the cost calculation above, we can know that for a daily activity of 10,000, the annual cost of each daily activity is about 6 cents to 7 cents. This cost is already relatively It's cheap.
At present, statistics on the market, such as Youmeng statistics, are also charged. When the daily activity reaches 10,000, the annual fee needs to be 3109 yuan/year (and this is only the cost of web statistics, and the cost of APP statistics is calculated separately). At the same time, it is not a source code version, the code is not open source, and cannot be customized at will.
And uni statistics is full-platform statistics, open-source code, free customization, which cannot be achieved by three-party statistical platforms.
Looking back at the calculation table just now, assuming that the DAU is 10,000, the annual cost of uni statistics is only 53.31*12=639.72 yuan/year.
| Daily Active | Cloud Function (RMB/month) | Cloud Database (RMB/month) | Front-end Web Hosting (RMB/month) | Monthly Total (RMB/month) |
|---|---|---|---|---|
| 100 | 0.14 | 0.42 | 可忽略不计 | 0.56 |
| 1000 | 1.10 | 4.24 | 可忽略不计 | 5.34 |
| 10000 | 10.93 | 42.38 | 可忽略不计 | 53.31 |
| 100000 | 100.97 | 423.85 | Negligible | 524.82 |
It should be the pursuit of smart engineers not to repeat manufacturing wheels, focus on business, quickly verify models, and achieve business growth.
This review is for your reference.
unistatistics 2.0 database queries. Because redis is billed according to capacity, no matter how many reads and writes are made, it will not cost more. For how to enable redis, please refer to Enable redis cache above.uni-config-center) to the associated service space. For the configuration item description, please refer to the above [common module configuration item description](#%E5%85%AC%E5%85%B1%E6%A8%A1%E5%9D%97%E9%85%8D%E7%BD %AE%E9%A1%B9%E8%AF%B4%E6%98%8E).因为uni统计2.0的统计数据最小颗粒度为小时数据(即每小时统计上一个小时的数据),所以,在上报数据后一个小时左右,方可在uni-admin管理后台看到统计数据。若想在测试阶段快速看到统计数据,可在uni-admin项目下创建一个云函数,并在HBuilderX中右键关联uni-stat公共模块,然后复制下方示例代码至测试云函数中,按需修改任务类型、运行时间、批次类型等参数后,在HBuilderX中右键云函数目录,选择本地运行云函数即可。
注意
示例代码:
'use strict';
const uniStatCron = require('uni-stat').initStat()
//手动跑批任务,需要先关联uni-stat公共模块
exports.main = async (event, context) => {
	const date = new Date()
	const thisTime = date.getTime()

	let res = await uniStatCron.stat({
		type: 'stat', //任务类型,stat:基础统计、page:页面统计。。。,任务类型及跑批时间可查看文档(https://uniapp.dcloud.net.cn/uni-stat-v2.html#%E5%AE%9A%E6%97%B6%E4%BB%BB%E5%8A%A1%E9%85%8D%E7%BD%AE%E8%AF%B4%E6%98%8E)
		date: thisTime, //运行时间,设置为当日,跑昨天的数据
		dimension: 'day', //批次类型,hour:小时 day:天  week:周 month:月
	})

	//返回数据给客户端
	return res
};
在HBuilderX中找到需要统计的项目,点击根目录下的mainifest.json文件,然后点击源码视图,找到最外层的uniStatistics节点(注意是最外层的uniStatistics节点,不是各平台节点下的uniStatistics节点!),并在此节点添加uniCloud配置项。配置项中有关服务空间的配置信息,可登录uniCloud控制台,点击服务空间详情查看。
注意
uni-admin项目关联的服务空间下的数据库中。uniCloud节点配置项示例:
//uni-admin部署在支付宝服务空间配置示例
"uniStatistics" : {
	"enable" : true,
	"version" : "2",
	"uniCloud" : {
		"spaceId" : "spaceId",
		"provider" : "alipay",
		"secretId": "AK",
		"secretKey":"SK",
		"appId":"SpaceAppId"
	}
}
//uni-admin部署在阿里云服务空间配置示例
"uniStatistics" : {
	"enable" : true,
	"version" : "2",
	"uniCloud" : {
		"spaceId" : "spaceId",
		"provider" : "aliyun",
		"clientSecret": "ClientSecret"
	}
}
//uni-admin部署在腾讯云服务空间配置示例
"uniStatistics" : {
	"enable" : true,
	"version" : "2",
	"uniCloud" : {
		"spaceId" : "spaceId",
		"provider" : "tcb"
	}
}

//uni-admin部署在软件版集群空间配置示例
"uniStatistics" : {
	"enable" : true,
	"version" : "2",
	"uniCloud" : {
		"spaceId" : "spaceId",
		"provider" : "dcloud",
		"clientSecret": "ClientSecret",
		"endpoint": "http://xxx.xx.xxx"
	}
}
A: It is related to the configuration of timed tasks. By default, data such as Statistics Home and Today's Overview are visible after 1 hour, and the rest of the data are visible the next day. To learn more about the statistical time of various types of data, please refer to [Scheduled Task Configuration Instructions](#%E5%AE%9A%E6%97%B6%E4%BB%BB%E5%8A%A1%E9%85%8D% E7%BD%AE%E8%AF%B4%E6%98%8E).
answer:
uniCloud directory of the uni-admin project are uploaded to the same uniCloud service space as the Appuni-stat-receiver cloud function has the correct request loguni-stat-cron cloud function has a regular execution log, and the log shows that the execution is successful ;If Not Found the cofnig file is displayed in the log, check the sixth question below;uni-admin, you need to configure uni statistics 2.0 in the manifest of the uni-admin project and issue it again. Again, don't confuse business App and adminAnswer: Generally, you do not need to configure it yourself, but if the time-out occurs in the Scheduled Task Cloud Function (uni-stat-cron), you should consider enabling the minute-level scheduled task.
uni统计运营管理员账号答:参考uni-admin 给系统创建多个登录账户并设置不同的权限
Answer: The formula for calculating the total number of devices is: total number of devices = number of original devices + number of new devices, and the basis for judging whether a device is a new device is whether the time when the device last accessed an application has been stored in the client SDK If it is not stored, it is considered as a new device of the application (that is, when lvts=0, it is a new device, and when lvts>0, it is an old device). Therefore, if a device has accessed an application before, even if the data in the database is cleared at this time, since the time when the device accessed the application last time has been stored in the client SDK (that is, lvts > 0 at this time), the device It will no longer be considered as a new device of the application, so it will no longer be counted into the total number of devices of the application, but will only be counted into the number of active devices. At this time, the total number of devices may be less than the number of active devices. Condition.
Business App and admin are 2 projects. The business app is the collection end, and the admin is the report end; both projects contain uni-config-center; if these two projects are associated (multiplexed) with the same service space, it is easy to appear uni-config-center `The mutual coverage problem; at this time, it is recommended to maintain a single point, there are 2 solutions:
uni-stat folder under uni-config-center in the uni-admin project to the uni-config-center directory under the business app project, and then Just re-upload the uni-config-center public module under the business App project.uni-admin: Manually merge the configuration items under the uni-config-center under the business App project into the uni-config-center under the uni-admin project (Note: manual Merge the configuration items, do not overwrite the file as a whole), and then re-upload the uni-config-center public module under the uni-admin project.首先分三步骤
第一步:添加用户角色权限
去权限管理,添加一个权限id为:READ_UNI_STAT 的权限
去角色管理,添加一个角色id为:READ_UNI_STAT 的角色
去用户管理,赋予子账号角色 READ_UNI_STAT 角色
第二步:给相关的表设置read权限
涉及表如下:
uni-stat- 开头的表需要赋予上面的表的 read 权限
将上面的表的 read 权限全部设置为
"permission": {
	"read": "'READ_UNI_STAT' in auth.permission",
	"create": false,
	"update": false,
	"delete": false
},
第三步:前往菜单管理,对每一个uni统计的页面(包含子页面)设置下权限 READ_UNI_STAT(菜单只有拥有对应权限才会显示)
答:首先登录uniCloud控制台,检查在出现问题的统计项配置的时间点(参考:定时任务配置说明),uni-stat-cron云函数的运行日志,如果运行日志前面的状态标识是灰色的,代表云函数运行超时了,此时在云函数详情中将uni-stat-cron云函数的超时时间设置到最大值即可。如果运行日志的状态标识是绿色的,则需要检查日志内容是否有报错,然后根据报错内容做出调整。
答:uni统计能够产出注册用户统计数据的前提是,开通uni统计的应用与uni-admin项目关联了同一个服务空间,且用户模块使用了uni-id用户体系,如果你应用的用户存储在非uniCloud业务,或者没有使用uni-id用户体系,uni统计将无法自动统计注册用户数据。

答:同上方常见问题10一样,都是因为在本地调试时,未在HBuilderX下方控制台选择连接云端云函数导致。
不掌握如下文档,很难对 uni统计2.0 吃透和做二次开发